

1. Climate Maps comparison
Now that we are receiving all the juicy details of topographic modifiers in the game, and lots of people are discussing it, I'd like to show how Tinto's classes relate to the full Köppen Classification.
Köppen uses 30 categories, which Tinto (understandibly) wittled down to 8.
Considering climate in game represent both climate phenomena (winters, monsoons, droughts,...) AND represents food availability/development potential, I went down the rabbit hole, and delved deeper into crop yields for each climate zone.
You can view my full statistical analysis for each crop in my google doc here, with graphs (which I'll also highlight futher down the post).
All GIS files can be found on my GitHub page, including non-food files for Tobacco, Coffee, Cocoa, Flax, Sugarcane, Olives and Tea.
[I'll update files/typing errors int he following days]

2. Individual crops, and their inherent potential for each Köppen zone
We can view the potential performance of crops in 3 ways:
I can highly recommend reading on their methodology in the documentation.
Especially from p 147 onwards is very interesting (with detailed tables of yields for each crop within AEZ-category.

Keep the following things in mind:
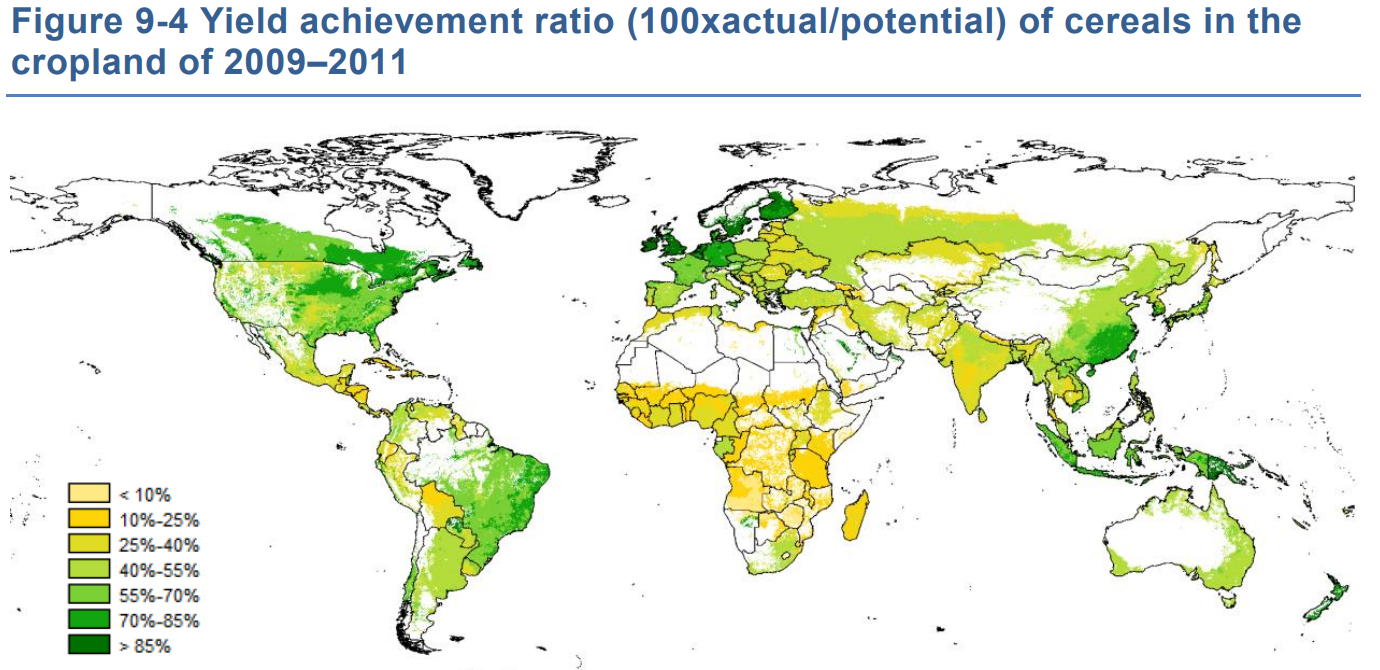
EDIT: Yield Achievement ratio.
Despite the high attainability of crops for most climates, reality dictates that due to limitations in technology, logistical issues regarding transport, labor and materials, access to fertilizers, impractical seasons that make it difficult to have consistent growing seasons,... mean that a lot of nations will not achieve the "high inputs" map.
This difference is called the 'yield achievement ratio', and here's the map for how well regions can achieve the theoretical models.
3. Analysis of Crop Yields per Köppen Zone
In GIS, we can calculate 'zonal statistics', where we calculate the mean yield of each crop for a unit of surface area.
We can then compare all the yields to see which Köppen zone is the most diversely fertile ("general food"), or if specific regions lack the requirements for a specific crop (like rice in Oceanic).
The results and graphs are made available in the google sheets link.
All GIS files, statistics files and images can be found on my GitHub page.
4. Conclusions
Now that we are receiving all the juicy details of topographic modifiers in the game, and lots of people are discussing it, I'd like to show how Tinto's classes relate to the full Köppen Classification.
Köppen uses 30 categories, which Tinto (understandibly) wittled down to 8.
Considering climate in game represent both climate phenomena (winters, monsoons, droughts,...) AND represents food availability/development potential, I went down the rabbit hole, and delved deeper into crop yields for each climate zone.
You can view my full statistical analysis for each crop in my google doc here, with graphs (which I'll also highlight futher down the post).
All GIS files can be found on my GitHub page, including non-food files for Tobacco, Coffee, Cocoa, Flax, Sugarcane, Olives and Tea.
[I'll update files/typing errors int he following days]
| Tropical | Subtropical | Mediterranean | Oceanic | Continental | Arctic | Cold Arid | Arid | Desert | Sparse | Grasslands | Farmlands | Woods | Forest | Jungle | Wetlands | Flantlands | Plateau | Hills | Mountains | |
| Population capacity | +50% | +100% | +150% | +50% | +50% | -50% | 10k | 25k | 50k | 100k | +50k | +25k | +50k | -80% | ||||||
| Development growth | -10% | -25% | -10% | +10% | -20% | -25% | -50% | -30% | -25% | -30% | -70% | |||||||||
| Life expectancy | -5 | -5 | -5 | |||||||||||||||||
| Attracts pops? | Yes | Yes | Yes | Yes | Yes | No | No | Yes | ||||||||||||
| Winters | None | Mild | None | Mild | Normal | Severe | Mild | No | ||||||||||||
| Precipitation? | No | No | ||||||||||||||||||
| Wheat Production | -10% | -10% | ||||||||||||||||||
| Food Production | -0.33 | +10% | +33% | +10% | -10% | -10% | -20% | |||||||||||||
| Unique weather? | Sandstorms | winter blocked | ||||||||||||||||||
| Road build time | +10% | -10% | +10% | +25% | +50% | +200% | +75% | +25% | +50% | +200% | ||||||||||
| RGO build time | +50% | +33% | +50% | +25% | +25% | +25% | +100% | |||||||||||||
| RGO max size | +10% | |||||||||||||||||||
| Army movement cost | +10% | +10% | +25% | +50% | +100% | +50% | +25% | +50% | +100% | |||||||||||
| Attacker Dice Roll | -1 | -1 | -1 | -1 | -1 | -1 | -2 | |||||||||||||
| Max battle frontage | -2 | -3 | -4 | -3 | -1 | -3 | -4 | |||||||||||||
| Blocks adjacent vision | Sea | Sea+Land | Sea+Land | Sea | Sea+Land | Sea+Land |
| Tinto's Climate World Map | Tinto's 8 categories colored in on Köppen | the Köppen climates in full spectrum | The games climates according to my personal taste in regards to gameplay. |

| 
| 
| 
|
2. Individual crops, and their inherent potential for each Köppen zone
We can view the potential performance of crops in 3 ways:
- We focus on climate alone
- We will not factor in 'high input' of fertilisers, as we are not considering soil suitability either
- pure theoretical performance of a crop, accounting for all climate factors (evaporation, rain,...)
- We focus on climate + soil suitability WITHOUT fertilisation (= Attainable Yield, Low Input)
- More in line with what would be realistically attainable in the late medieval period
- We focus on climate + soil suitability WITH fertilisation (=Attainable Yield, High Input)
- This is what we in our modern society should be able to extract with maximised efforts
I can highly recommend reading on their methodology in the documentation.
Especially from p 147 onwards is very interesting (with detailed tables of yields for each crop within AEZ-category.
- The first map in Theme 1 is the "agro-ecological zones" (AEZ) map of the FAO. This is an alternate climate categorisation including soil characteristics, specifically for agriculture.
- This is basically 'the climate map for crops'
- Some categories are remarkably similar despite their differences in the Köppen zone (e.g. Oceanic and Continental, Arid and Cold Arid)
- Includes 'irrigated' zones such as the Nile, Mesopotamia,...
- Includes 'unsuitable terrain' as a category
Keep the following things in mind:
- Crop performance is dependent on five factors:
- Soil suitability
- Climate
- Artifial irrigation
- Use of fertilisers
- The crop itself
- the inherent soil suitability (base)
- no matter what else, if plants can't take root, you can forget about all other factors
- Currently not implemented in game whatsoever
- the climate (modifier)
- no matter how good the soil, if it is too dry or too wet for that crop, the crop will struggle
- Has great potential to be expanded upon
- artificial irrigation (neutraliser)
- Places that struggle with too much or too little water access, can be irrigated to alleviate (or even remove) the climate problems
- River / irrigation presence could be checked to 'erase' climate/terrain negatives
- Fertilisation (amplifier)
- Some climates or soils can yield surprising amounts of produce with the right investments
- Development level (amount of 'input') and specific technologies ('fallow fields') could impact produce output in specific terrains and climates.
- great soil, terrible climate, no potential for irrigation: Tarim basin, Gobi desert
- great soil, terrible climate, good potential for irrigation: Nile river valley, Indus river plain, Mesopotamia
- unsuitable soil, great climate, good potential for irrigation: Upland Korea
- EDIT - IMPORTANT NOTE: this assumes that all places on earth use the same inputs and have access to the same technologies/logistics. This is obviously NOT the case in real life!
- Some regions will IRL have results similar to the map of 'high inputs' (e.g. SE England), while some regions despite their best efforts will be limited towards the results of the 'low inputs' map (e.g. central Spain, tropics).
- Historical technologies of each region/climate will ensure that MOST regions cannot achieve the results of the "high inputs" map, even in modern times.
| Food Crop | Theoretical Climate Potential | Actual Attainable Yield - No fertiliser ("Low Input") | Actual Attainable Yield - High fertiliser ("High Input") | Histogram of Crop Yield for each climate, for each version |

Wheat | 
| 
| 
| 
|

Sturdy Grains (barley, buckwheat, oats, millet, sorghum, rye) | 
| 
| 
| 
|

Rice (dry- and wetland rice) | 
| 
| 
| 
|

Legumes (phasoleus, chickpea, cow pea, pigeon pea, gram, groundnut) | 
| 
| 
| 
|

Soybeans | 
| 
| 
| 
|

Maize | 
| 
| 
| 
|

Tubers (White Potato, Sweet Potato, Yam, Cassava) | 
| 
| 
| 
|
EDIT: Yield Achievement ratio.
Despite the high attainability of crops for most climates, reality dictates that due to limitations in technology, logistical issues regarding transport, labor and materials, access to fertilizers, impractical seasons that make it difficult to have consistent growing seasons,... mean that a lot of nations will not achieve the "high inputs" map.
This difference is called the 'yield achievement ratio', and here's the map for how well regions can achieve the theoretical models.
3. Analysis of Crop Yields per Köppen Zone
In GIS, we can calculate 'zonal statistics', where we calculate the mean yield of each crop for a unit of surface area.
We can then compare all the yields to see which Köppen zone is the most diversely fertile ("general food"), or if specific regions lack the requirements for a specific crop (like rice in Oceanic).
The results and graphs are made available in the google sheets link.
All GIS files, statistics files and images can be found on my GitHub page.
| Climate only | Climate + Soil suitability - Low Input | Climate + Soil suitability - High Input Needs redo because of the potatoes map | |
| Sorted according to Köppen Classification | 
| 
| 
|
| Sorted according to Tinto Categories | .png "Climate as only factor (1).png")
| .png "Climate Soil factors Low inputs (1).png")
| 
|
4. Conclusions
- The top 5 most productive climates (Attainable Yield - Low Input) are:
- Dfa - Hot-summer humid continental
- Cfa - Humid Subtropical
- Dwa - Hot summer continental
- Dfb - Warm-summer humid continental
- Cwa - Dry winter humid subtropical
Potatoes should perhaps be renamed to "Tubers", as its cousins are very intensively grown in (Sub)Tropical regions. Edit: maybe potatoes is better after all... Potatoes and yams are tubers, whereas taro and cocoyams are derived from corms, underground stems, and swollen hypocotyls. Cassava and sweet potatoes are storage roots and canna and arrowroots are edible rhizomes.- Soybeans do not appear to behave very differently from all other legumes, so imo could be merged with legumes.
- The treatment of merging "BSk: Cold Semi-Arid" into "Cold Arid", and "BSh: Hot Semi-Arid"into "Arid" is too punishing for the semi-arids.
- EDIT: The grasslands/woods/farmlands topography could perhaps represent the semi-arids, but should allow for migration then.
- Maybe invert the logic: make desert/sparse the condition that doesn't attract migrants. Although I agree Arctic should keep the modifier.
- EDIT: The grasslands/woods/farmlands topography could perhaps represent the semi-arids, but should allow for migration then.
- The current Continental category is perhaps too broad, especially looking at crop yields and winter severity. A colder and more temparate variant wouldn't hurt.
- The Tropical Savannah climate is noticably more fertile than its other Tropical counterparts, a category perhaps worth splitting.
- EDIT: the vegetation modifiers could be utilised to make the Savannah region more suitable.
Last edited:
- 65

- 37
- 20
- 4

