• We have updated our Community Code of Conduct. Please read through the new rules for the forum that are an integral part of Paradox Interactive’s User Agreement.

Tinto Maps #24 - 25th of October - Japan and Korea

Hello and welcome once more to another week of Tinto Maps. This week we are going to the lands even further to the East and taking a look at Korea and Japan. So, without further ado, let’s get started.

Countries
Countries.png
Colored wastelands.png

Korea during the Goryeo dynasty was under the orbit of Yuán, and had very close ties with it, with the Yuán emperors taking Korean wives. The north, though, and also Tamna in the Jeju island wouldn’t be unified under Korea until the following Joseon dynasty, so they are still separated although all of them also under Yuán. On the other side, Japan starts in a very interesting situation. After a failed attempt to overthrow the shogunate and restore imperial power during the Kenmu restoration, one of the generals that contributed to such restoration, Ashikaga Takauji, in the end established his own shogunate in 1336 (just before the start of the game). The emperor had then to flee the capital and thus we start with the period of the Northern and Southern Courts, with two opposing Emperors and the shogun fighting for legitimacy. So, although it appears unified at first glance, Japan hides many internal divisions within (more on that later). Further South, the kingdom of Ryūkyū is not yet unified, so the three mountain kingdoms of Hokuzan, Chūzan and Nanzan vie for supremacy over the island.

Societies of pops
Societies of Pops.png

Basically already shown in the Manchuria Tinto Maps, but they need to be shown here too, especially the Ainu.

Dynasties
Dynasties.png

Dynasties zoom.png
As it happens in China, the “Goryeo dynasty” name is actually not the name of the dynasty itself, which is actually the house of Wang.

Locations
Locations.png

Locations zoom 1.png
Locations zoom 2.png
Locations zoom 3.png
Locations zoom 4.png
Locations zoom 5.png
Locations zoom 6.png
Locations zoom 7.png
Locations zoom 8.png

Provinces
Provinces.png

Provinces zoom 1.png
Provinces zoom 2.png
Provinces zoom 3.png
Provinces zoom 4.png
Provinces zoom 5.png
Provinces zoom 6.png
Here (as well as with the areas next) we have tried to follow the administrative division of both countries in period, but we’ve had to make some adjustments. In Korea, we had to account for the fact that historically, almost immediately after the start of the game the Josen dynasty took over and the administrative divisions are somewhat different, so we’ve adjusted them together (and had to divide some of the bigger provinces for gameplay reasons). In Japan, the administrative divisions remained virtually unchanged since the establishment of the Ritsuryō system in the 7-8th century until after the Meiji restoration in 1868. However, we still had to make some adjustments, and the smaller ones had to unfortunately disappear.

Areas
Areas.png


Terrain
Topography.png
Vegetation.png
Climate.png

Very mountainous and forested areas both, so the few plains have to be taken the most advantage of.

Development
Development.png

Not bad developed areas, but obviously development decreases the further north it goes.

Natural Harbors
Natural Harbors.png


Cultures
Cultures.png

Korea is mainly Korean, and Japan has been divided into four main groups. Besides this, we also have Ainu in the north, Jeju in Jeju island and Ryūkyū in the Ryūkyū islands.

Religions
Religions.png

Korea has the same (name pending) religion as China while Japan is Shintō. I must say that this Shintō is not at all considered to be a Kami-exclusively-oriented Shintō nor the post-Meiji State Shintō in any shape or form. In all effects, it is considered under the Buddhism umbrella and it is treated as Buddhist Shintō, while of course including some different mechanics and references to the Kami too. The name Shintō was chosen basically because it’s more recognizable and identifiable with Japan. Besides this, there’s also the Ainu religion for the Ainu, and the Utaki religion for the Ryūkyū.

Raw Materials
Raw Materials.png

Raw Materials zoom 1.png
Raw Materials zoom 2.png
Raw Materials zoom 3.png
Raw Materials zoom 4.png
Raw Materials zoom 5.png
Not bad areas for resources, and plenty of rice and fish in Japan to get good sushi. The more observant of you will see that the resources of Hokkaido have already been adjusted thanks to feedback from the previous Manchuria Tinto Maps.

Markets
Markets.png

Some may find surprising the presence of Izumi as a Market in Japan, but it is the area that served as the main point of entrance for commerce into central Japan, where the merchant town of Sakai developed, until later Osaka developed under Toyotomi and basically took over that function.

Population
Population.png

Population zoom 1.png
Population zoom 2.png
Population zoom 3.png
Population zoom 4.png
Population zoom 5.png
Population zoom 6.png
Population zoom 7.png
Not much to say here, except that quite a bit of population waiting for some action.

Extraterritorial Countries
Extraterritorial Countries.png

Extraterritorial Countries zoom 1.png
Extraterritorial Countries zoom 2.png
Extraterritorial Countries zoom 3.png
I’m sure many of you were waiting for this. The samurai clans in Japan are represented as Extraterritorial Countries, and we have tried to be as close as possible to their distribution of territory in 1337. As you can imagine, that is not an easy task, and some more tweaking is needed, so if you have any feedback or extra info on that regard it would be much appreciated. Unfortunately, there’s some overlapping of some clans on the same territory and only one name can be shown at a time, so not all names are visible (the Oda clan is still there, I promise), but there are a total of 143 clans (not counting Ashikaga), plus two extra for each of the imperial courts that are present at start. Related to this, each clan will pledge its allegiance to either the northern or the southern court, mainly based on their historical allegiances but allowing a bit of leeway (and those allegiances don’t necessarily have to be permanent). So, as a bit of an extra tease, these are the allegiances of the clans at start (yellow are the north court supporters, blue are the southern court ones, and again keep in mind that only one color can be present even if there’s more than one clan with different allegiances in the same location)
Nanbokuchou.png

And that is all for today. Next week there will not be any Tinto Maps due to being a bank holiday, so next one will be in two weeks for a look further south into South East Asia. See you there.
 
  • 167Love
  • 117Like
  • 4
  • 4
  • 2Haha
Reactions:
How do you guys plan to account for the change in RGOs overtime? For example during this period of Japanese history cotton is largely limited as a luxury good for the wealthy, but it started to be widely grown in the late fifteenth century, and by 1700 had become the standard fabric for Japanese commoners, replacing hemp. There’s a similar story for sugar production in Ryukyu as well, it was a huge producer for Japan, but sugarcane production was only introduced in 1374.

https://samurai-archives.com/wiki/Sugar


Sugar cane was first introduced into the Ryûkyû Islands in 1374. It soon became one of the Ryûkyû Kingdom's chief exports / tribute goods. Between sugar obtained from the kingdom, and sugar grown in the Amami Islands (taken from the kingdom and under the direct control of Satsuma han since 1609), Satsuma served as the chief source of sugar in Japan throughout the Edo period.


Cotton was first introduced to Japan in the late Nara or early Heian period, but only began to be grown in any significant sense in the late 15th century. By the end of the 17th century, it was the most standard fabric for commoner clothing, replacing ramie.
 
  • 7Like
  • 2
Reactions:
Don't wanna be that guy but aren't some places kinda of too dense? Tsushima which is 700km2 with 2k people has 2 locations, which is more location density than in all of Europe. Japan in general has highest province density in the world right now
 
Last edited:
  • 11
  • 8Like
  • 1Haha
Reactions:
It's specific for Japan, so that the country breaks apart and there's a proper Sengoku Jidai.
How exactly does that Snegoku Jidai work and country breaking apart?
Will it be like some disaster that ticks up slowly? Or some own form of mechanic? With some form of support and opposition tied together with the Samurais getting too much power and some other stuff I'm unable to think of currently?
 
  • 1Love
  • 1
Reactions:
I wonder what kind of trophies Japan will have? I hope we get some tokusatsu themed trophies. its a dying art form. Like if a event could mention a large dragon off at sea glowing blue, id be a happy camper. or if Okinawa had a mention of a kaiju lion statue protecting it.

just kidding, I know thats not gonna happen but I know some of the devs watch Godzilla based on their comments over the years
 
The Kanto Plain was developed from the Tokugawa Shogunate period in the 17th century. Even when you think about the Kamakura Shogunate, only the Kamakura Province and its surroundings are high, and the Kanto Plain area is only a swamp that was not cleared at that time. In 1337, It is likely that the development will be lower than that of Kyushu and other japan's regions.
 
  • 8Like
  • 2
Reactions:
I hope that there will be substantial representation of Buddhism in Japanese religion mechanics. No formal distinction between Shinto and Buddhist practice was made until the Meiji restoration, after PC's end date.
Also, if Japan is divided into 3 cultures, then England definitely should have English culture broken up, as has been previously discussed.
The extraterritorial Daimyo are very interesting! I suspect there are many countries around the world, though, with similar nobility situations. This feels a bit like a half-implementation of CK3's representation of states like the HRE; I hope these kind of internal complexities are represented consistently throughout the world map.
 
  • 6
  • 2Like
Reactions:
Feedback on the Population of Goryeo

First of all, I'm not an English speaker, so please understand that English sentences may be awkward.
KakaoTalk_20241025_230910352.jpg

The population of Goryeo in 1337 shown in the image above is 2.509 million.

However, this 2.509 million is a big difference from the population of this period that today's Korean scholars estimate.

First, because there are no accurate records of the population during the Goryeo period, it is necessary to estimate the Goryeo population by back-calculating from the population figures of the Joseon period.

Regarding the population of the Joseon Dynasty, scholars have estimated that at the founding of Joseon (1392) the population was either about 5.54 million or in the range of 6.71 to 7.5 million.

The figure of 5.54 million at the founding of Joseon was first proposed by Kwon Tae-hwan and Shin Yong-ha in their work [Results from Research Using Demographic Methods] – [A Temporary Theory on Population Estimates of the Joseon Dynasty(Dec. 1977)].

KakaoTalk_20241025_230324101.jpg


This assertion became the most widely known in Korea and has since been regarded by scholars as an essential reference for understanding the population history of the Joseon period.

Next, the estimate of 6.71–7.5 million was proposed by Lee Young-koo and Lee Ho-cheol in [Results from Research on Agrarian Economic History] – [The Estimation of Population in the Choson Dynasty (Dec. 1988)] and by Lee Young-koo and Yoo Byung-gyu in [A Study of Population and Agricultural Productivity in the Early Joseon Dynasty (2004)].

In particular, under the assumption that a gradual increase in population is common during the transition from a pre-modern to a modern society, they criticized that Kwon Tae-hwan and Shin Yong-ha’s estimate of an early Joseon population growth rate of 0.47% was too high while the later growth rate of 0.21% was too low, and instead they estimated the early Joseon population growth rate to be between 0.15% and 0.2%.

Moreover, they presented the increasing population pressure on land and the corresponding agricultural output in both the early and later Joseon periods as key evidence.

Screenshot_20250212_071318_Samsung Notes.jpg

“The relationship between land and population in early Joseon shows that population pressure on land steadily increased over time. In 1550, there were 1.99 people per hectare, which rose to 2.35 people in 1650, 3.21 people in 1725, and finally reached 3.77 people by 1875. This indicates that as time progressed into late Joseon, population pressure on land intensified significantly, doubling over a period of approximately 300 years from 1550 to 1875.”

Screenshot_20250212_071450_Samsung Notes.jpg

“The following <Table 2> illustrates the trends in land productivity during the Joseon Dynasty. By dividing the dynasty into eight periods starting from 1444, when land productivity estimates are available, the productivity per 10 ares of land changed as follows:

1444: 21.13 du

1600–1650: 15.85 du

1700–1750: 25.3 du

1750–1800: 26.6 du

1800–1850: 30.1 du

1918–1922: 28.3–32.6 du


Land productivity showed an increasing trend during the late Joseon period. Using 1444 as a baseline, land productivity in 1918–1922 is estimated to have increased by approximately 34% to 54%.”

Screenshot_20250212_071353_Samsung Notes.jpg

"A typical example of the wide variation in results due to differences in interpretation of the same data is the determination of the population size during the Joseon Dynasty. First of all, the study by Kwon Tae-hwan and Shin Yong-ha (1977), which has been relied upon and cited by many scholars to this day, characterized the population of the Joseon Dynasty as 5.54 million.

However, using <Table 1> above and other sources, I estimated the population to be between 6.71 and 7.5 million. Although this numerical difference may seem slight, the resulting discrepancy is quite significant. Kwon Tae-hwan and Shin Yong-ha’s (1977) study underestimates the early period’s population size, which in turn leads to a considerably higher estimated growth rate in the later period. Their study estimated the population at the outbreak of the Imjin War in 1591 to be 13.73 million. As a result, they calculated the overall population growth rate of the Joseon Dynasty (1392–1591) as 0.47%, which is higher than the rate for the late Joseon period (1639–1910) of about 0.21%. In contrast, the authors estimate the early Joseon population at 6.71–7.5 million—about 1.2–2 million higher than the 5.54 million given by Kwon Tae-hwan and Shin Yong-ha (1977). Furthermore, the population in 1591 is estimated at about 9.33 to 10.12 million, roughly 4 million lower than their estimate. Consequently, the overall population growth rate for the Joseon Dynasty is calculated at 0.19%, which is lower than the 0.27% estimated for the late Joseon period."

Thus, they argued that the early Joseon population growth rate was 0.15–0.20%, lower than both the 0.338% estimated for the 17th–18th centuries (1639–1810) and the 0.176–0.265% for the later Joseon period (1639–1910).

Next, here is an evaluation of the various population estimates by recent Korean scholarship.

Screenshot_20250212_055246_Chrome.jpg

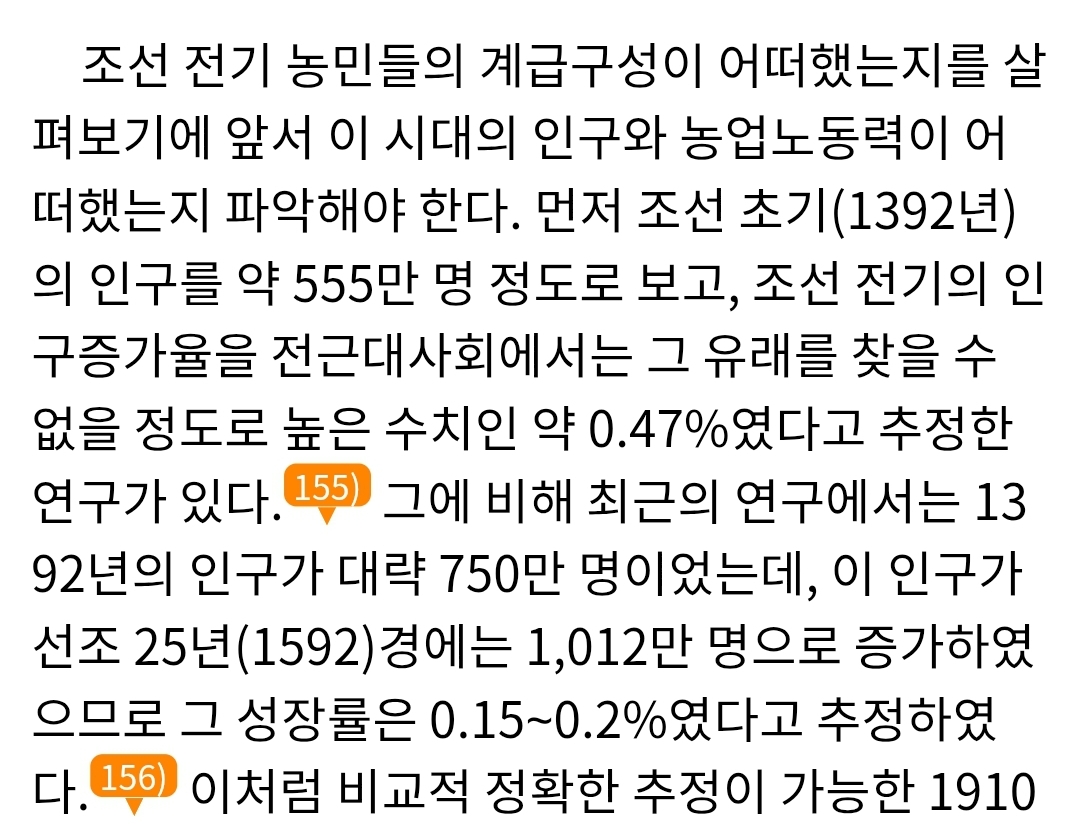
"Before examining the class composition of farmers in the early Joseon period, it is necessary to understand the population and agricultural labor force of the time. First, the population at the beginning of the Joseon Dynasty (1392) is estimated to have been around 5.55 million, and a study has suggested that the population growth rate during the early Joseon period was an exceptionally high figure of approximately 0.47%, unprecedented in pre-modern societies. In contrast, more recent research estimates that the population in 1392 was about 7.5 million, which increased to 10.12 million by the 25th year of King Seonjo's reign (1592), with a growth rate estimated at 0.15–0.2%."
[Excerpt from Korean History (1993–2003) – Volume 27 excerpt]

Screenshot_20250212_055503_Chrome.jpg

"Rigorous historical demographic studies on the Joseon Dynasty have only just begun, but the general outline and trends of the population during this period can be captured through general population history research. The main points are as follows: From the founding of Joseon (1392) to the Imjin War (1592), the population generally increased. In the early Joseon period, the population level was approximately 6 to 7 million, and it showed a peak increase around the mid-16th century. At that time, the population is estimated to have been around 9 to 10 million. The population, which steadily increased until the mid-16th century, then reached a plateau. This population level of approximately 10 million was likely the maximum that early Joseon's agriculture, centered on dry-field farming, could sustain."
[Excerpt from Korean Culture History (2001–2011) – Volume 26 excerpt]

These materials were excerpted from [Korean History (1993–2003)] and [Korean Culture History (2001–2011)], publications of the National History Compilation Committee of the Ministry of Education in Korea.

In summary, based on the above opinions, contemporary Korean academia tends to place more weight on the estimate of 6.71–7.5 million at the founding of Joseon—as proposed by Lee Young-koo and Lee Ho-cheol in [The Estimation of Population in the Choson Dynasty (Dec. 1988)] and by Lee Young-koo and Yoo Byung-gyu in [A Study of Population and Agricultural Productivity in the Joseon Dynasty (2004)].

Personally, I also hold in high regard the estimate from [Results from Research on Agrarian Economic History (6.71–7.5 million)], as it comprehensively analyzes the socio-economic changes in both the early and later periods of Joseon.

Therefore, taking the minimum (6.71 million), median (7.10 million), and maximum (7.5 million) figures from the [Results from Research on Agrarian Economic History (6.71–7.5 million)] estimate—and referring to the passage in Lee Tae-jin’s paper [On the Generation of Factors Contributing to Population Growth in Late Goryeo and the Development of Local Administrative Systems (Aug. 1988)] stating
"The population growth rate during the Goryeo Dynasty was around 0.1%, remaining within the levels of ancient and medieval societies."—if we back-calculate from 1392 at a growth rate of 0.1% to the year 1337, we can estimate that in 1337 the population was approximately:

1337
• Minimum: 6.35 million
• Median: 6.72 million
• Maximum: 7.10 million

Thank you for reading. (Edited February 12, 2025)
+++
[Or it could be 6 to 7.5 million, another estimate of the academic population of the Goryeo Dynasty.] -
[https://forum.paradoxplaza.com/foru...october-japan-and-korea.1710914/post-29963965]
+++
[Feedback Reconstructing the Location and Provinces of the Korean Peninsula] - [https://forum.paradoxplaza.com/foru...october-japan-and-korea.1710914/post-29969736]
+++
[Feedback on the Northeastern Region of Goryeo (Jurchen Tribes)] -
[https://forum.paradoxplaza.com/foru...october-japan-and-korea.1710914/post-30085315]


Thank you.
 

Attachments

  • KakaoTalk_20241025_230324101_01.jpg
    KakaoTalk_20241025_230324101_01.jpg
    357,7 KB · Views: 0
Last edited:
  • 26Like
  • 16
  • 2
Reactions:
Here’s some known tea producing locations from the 14th century, from William Wayne Farris’ book on the history of Japanese tea.


The habit-forming beverage, now sweeter and tastier than ever, pros- pered within this decentralized context. Beginning around 1350, a bud- ding tea industry began to emerge. Different regions of Japan competed against each other with their own unique brands of tea:
Of the famous tea mountains of our dynasty, Toganoo is the best. Ninnaji, Daigoji, Uji, Hamuro [in Yamato], Hannyaji [in Yamato], and Kannōji [in Tanba]: these are next. In addition, Muroo in Yamato, Yashima in Iga, Kawai in Ise, Kiyomi in Suruga, and Kawagoe in Musashi—all these are specially mentioned throughout the realm. The famous places at Ninnaji and Yamato and Iga compare to the tea fields here and there just like agate to trash. Then, too, Toganoo compares to Ninnaji and Daigoji like gold to lead.61
This quotation, taken from a source completed during the mid-fourteenth century, lists the most famous tea production centers in Japan. While the most delicious tea apparently still came from Yamato and Yamashiro, it is notable that tea drinkers could also find the tasty beverage in Tanba, Iga, Ise, Suruga, and Musashi.
-

These named places may have been the best, but tea patches were also located “here and there” throughout the realm. Other records dating to the period 1340–1400 describe fields in Saidaiji and Hamuro in Yamato, Yamashina (2), Uji (2), and Saga in Yamashiro, Kii (3), Settsu (3), Tanba (3), Izumi (2), Mino and Shimōsa (3).62 By the 1350s, tea was being cultivated, processed, and consumed widely throughout the Kinai, central Honshu, and the Kanto plain. As one writer of the 1300s put it, “new tea flows unexpectedly throughout the world.”63 Outstanding brand-name centers of tea had multiplied with the shift to a more regional political and eco- nomic structure, and would become an essential ingredient in the rise of a consumer society much later.
With many different brands competing against one another, tea was on its way to becoming big business, as is implied in this incident dated to the first half of the fourteenth century:
Thank you, we will take a look at it.
 
  • 36Like
Reactions:
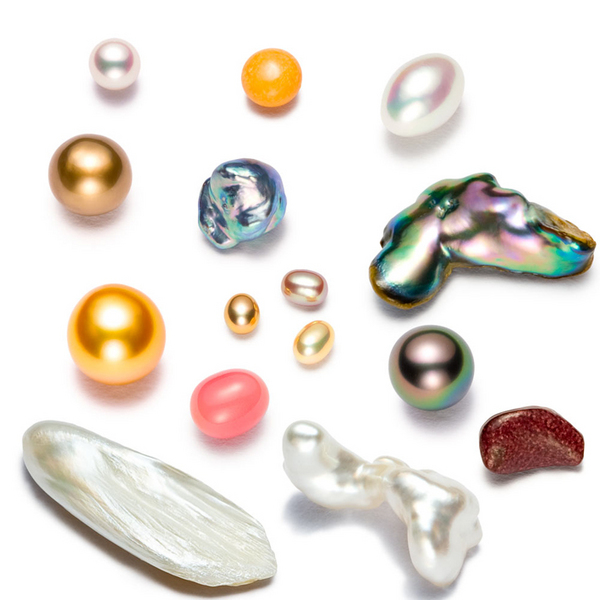
Some information about Japanese pearls, they were rather well known for their wealth in gold and pearls by the Yuan, could do with more Pearl provinces


(Japanese Wikipedia article on pearls and their history in Japan)

.
Japan has long been famous for its pearls. Freshwater pearls with holes in them, which are believed to have been threaded, have been excavated from Jomon-era sites in Hokkaido and Iwate Prefecture. In the "Biography of Wei Wei," it is written that Taino of Yamataikoku sent 5,000 white pearls to Cao Wei. The Nihon Shoki (Chronicles of Japan), Kojiki (Records of Ancient Matters), and Manyoshu (Anthology of Myriad Leaves) also mention pearls, and the Manyoshu includes 56 poems that mention pearls. In those days, pearls were called "tama," "matama," and "shiratama (white gem). In particular, Omura Bay in Hizen Province was a major source of natural pearls, as described in the "Hizen Province Fudoki. Emperor Keiko took from Hayaritsuhime [7] [8], Kenzusangen, and Yan Yan, who lived on the northern shore of the bay, three colored balls: a white ball, an Iso-no-kami itabidama (a ball of wood from the god Ishigami), and a beautiful ball. The emperor ordered that the land be called "Tamasonaukoku (Land of Tamashinaudama)" because of its abundance of jade, which is said to have given rise to the place name Sonogi. Those three colored balls became the sacred treasures of Ishigami Jingu Shrine.
In the Heian period "Engishiki" (Engi Shiki) "Zoshiki," it is described that the nobles sent their retainers to buy Tsushima pearls so actively that the people were confused.
Pearls were collected from Ago Bay in Shima Province (now eastern Mie Prefecture) and the Uwa Sea in Iyo Province (now Ehime Prefecture) from Akoya oysters, but they were smaller than pearls from other countries (foreign pearls).
Pearls were not only used as ornaments, but also had a magical meaning. Pearls are sometimes counted as one of the seven treasures of Buddhism, and pearls have been unearthed from temple sites as one of the ritual objects used in ground-breaking ceremonies when the temples were built. Because of their unique luster, they were also believed to be effective as a medicine for eye diseases and as an antidote [9].
The beauty of Japanese pearls was even introduced to Europe, and Columbus was said to have admired them.

Translated with DeepL.com (free version)
 
  • 1
Reactions: