I figure here is a good place until the game is released and there's more meat on the bones to actually work on.I am curious. I'm cooking up an Alt-History mod. Would it be acceptable to post journals as a thread here starting this summer or should i just wait for the release of the game?
What mod will born in eu4?
- Thread starter Vlad123
- Start date
-
We have updated our Community Code of Conduct. Please read through the new rules for the forum that are an integral part of Paradox Interactive’s User Agreement.
You are using an out of date browser. It may not display this or other websites correctly.
You should upgrade or use an alternative browser.
You should upgrade or use an alternative browser.
The british isles dark age mod guy basically started that alreadyI am curious. I'm cooking up an Alt-History mod. Would it be acceptable to post journals as a thread here starting this summer or should i just wait for the release of the game?
- 1
By knowing python I guess, there's not really a secret recipe here, the bulk of the data I manipulate is in a ginormous json file that I read through the json library to dump into a dictionary, and I read and write images through PIL.image.Thanks for the info! If you dont mind me asking, how did you actually write the python script? I'm tempted to make my own (though much smaller scale) map akin to this
I generate similar colours by grabbing (R, G, B) with random.randint and then (R+20, G, B), (R, G+20, B), (R, G, B+20), (R+20, G+20, B), etc... And when I want them blue, I ensure that B > G > R.
I check they're unique by keeping a set of already used colours at all times.
The striping itself looks like this:
for pixel in pixels:
....if (max_x - min_x) > (max_y - min_y):
........index = int((pixel[0] - min_x) // ((max_x - min_x) / len(new_colors)))
....else:
........index = int((pixel[1] - min_y) // ((max_y - min_y) / len(new_colors)))
....while index >= len(new_colors):
........index -= 1
....img.putpixel(pixel, new_colors[index])
img.save("output.png")
Where:
- pixels is a list of (x, y) coordinate tuples for a province (soon to be cut into locations)
- max_x, min_x, max_y, min_y are the min and max coordinates belonging to the province
- the if/else decides whether the strips are horizontal or vertical
- new_colors is a bunch of new colours generated through the (R+20, G, B) thingy
- img is the image read through PIL
- the while is bullshit, I must have been half-awake then

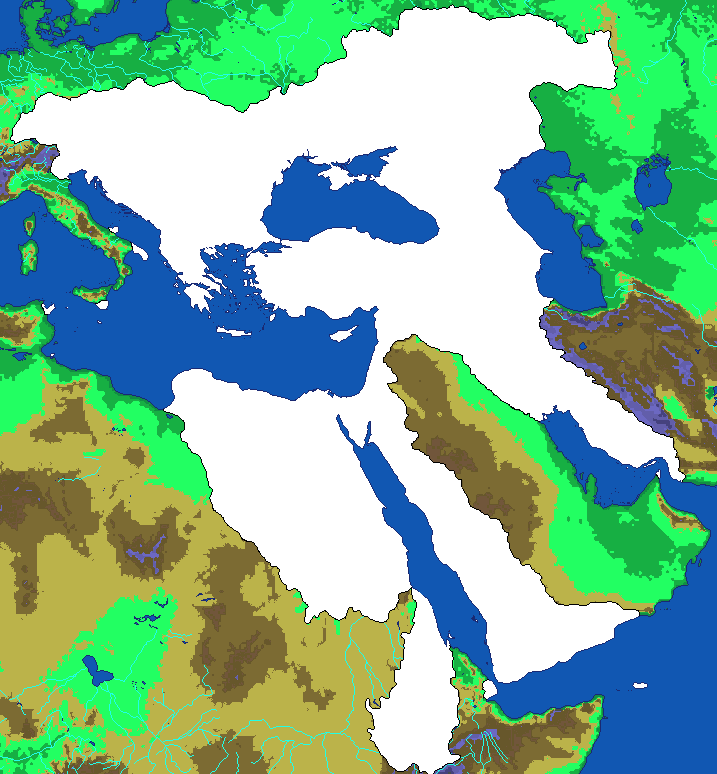
I'm curious what you guys think of this map. Not the border itself but the style of the map.
From the research i did on mapmaking I understand that vector programs are preferable but I used a raster software in this case.
The borders mostly follow natural borders, ideally i would have liked to use the locations of EU5 but seeing as 1. the map isn't done yet and 2. some locations break natural boundaries like rivers I am more inclined to draw my own locations when necessary.
- 1
Bronze Age mod?I'm curious what you guys think of this map.
No actually, my bad, in retrospect i can see how ti could be confused, I should have been clearer.Bronze Age mod?
This is for an Alt-History mod, inspired by one of my CK3 Fallen Eagle campaigns
- 1
I promise you there will be Holy Roman Empire with France in it (Holy Carolingian Empire).
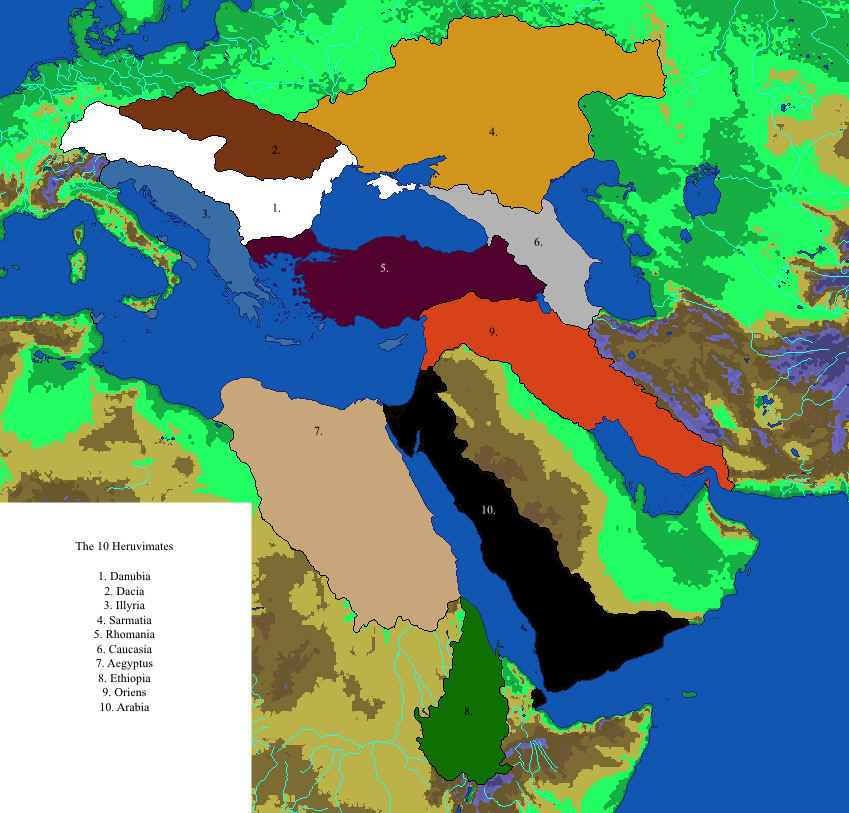
Teaser #2
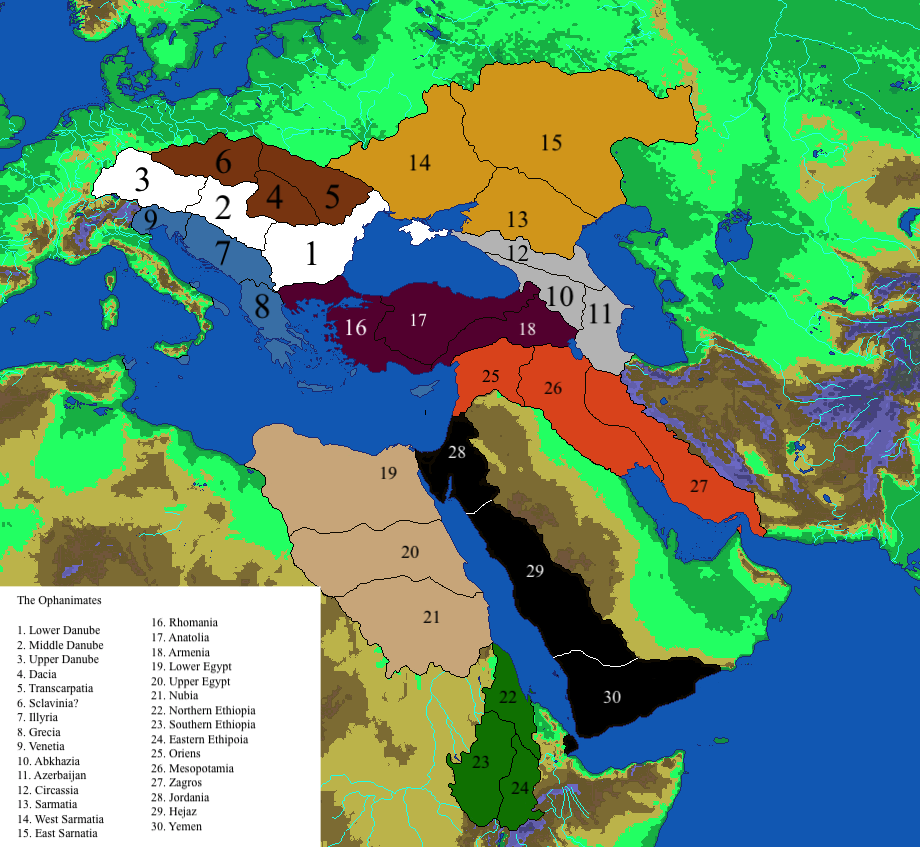
The 30 Ophanimates

Some questions for anyone willing to help me out a bit:
1. Anyone know why the text quality drops so much when using Mac's image editing tool?
2. What would be the better name pick for #11 Albania or Azerbaijan considering the region(especially "Albania" ie the region near the mountains) as conquered pre islamization and the rise of the Shirvanshahs
3. Does anyone have any sources on what the Byzantines or late romans called the Lands west of the Dnieper and east of the Volga? I know the Sarmatia was often used as a synonym for the Pontic Steppe, but other than using titles like "lands of the Bulghars" or "lands of the Khazars" depending on which Nomadic Tribe of the week controls it
4. For the Ethiopia history fans, if you were to divide the Aksumite Empire into 3 areas corresponding to 22, 23 and 24. I mean EU5 uses "Northern Ethiopia", "Central Ethiopia" and "Southern Ethiopia". CK3 uses names for duchies like Gondar and Shewa which are post Solomonic and frankly I don't know where to begin doing research on Aksum except wikipedia which is not very helpful. I guess i could just use post-Solomonic names it just feels so anachronistic considering the divergence point is in 476.
Thank you.
The 30 Ophanimates

Some questions for anyone willing to help me out a bit:
1. Anyone know why the text quality drops so much when using Mac's image editing tool?
2. What would be the better name pick for #11 Albania or Azerbaijan considering the region(especially "Albania" ie the region near the mountains) as conquered pre islamization and the rise of the Shirvanshahs
3. Does anyone have any sources on what the Byzantines or late romans called the Lands west of the Dnieper and east of the Volga? I know the Sarmatia was often used as a synonym for the Pontic Steppe, but other than using titles like "lands of the Bulghars" or "lands of the Khazars" depending on which Nomadic Tribe of the week controls it
4. For the Ethiopia history fans, if you were to divide the Aksumite Empire into 3 areas corresponding to 22, 23 and 24. I mean EU5 uses "Northern Ethiopia", "Central Ethiopia" and "Southern Ethiopia". CK3 uses names for duchies like Gondar and Shewa which are post Solomonic and frankly I don't know where to begin doing research on Aksum except wikipedia which is not very helpful. I guess i could just use post-Solomonic names it just feels so anachronistic considering the divergence point is in 476.
Thank you.
- 3
Yes, his name comes from the emperor of the Seljuk Empire. But the background of the manga is the Persian Empire, which represents Japanese writers mixing different ethnicities and histories together.Isn't his name supposed to be a direct call to alp arslan the seljuk emperor?
Haha, I have only seen a very small part. The main reason I watched this anime is because of the male protagonist. Hey, I've always liked Japanese anime boys with long hair.Ayoo! didn't think I'd hear The Heroic Legend of Arslan in a paradox forum haha
- 1


