• We have updated our Community Code of Conduct. Please read through the new rules for the forum that are an integral part of Paradox Interactive’s User Agreement.

Victoria 3 - Dev Diary #29 - User Experience

16_9.jpg

Hello, my name is Henrik and I am a UX Designer on PDS. I have been a part of the Victoria 3 team for almost the entirety of the project, and since I am about to take a few months of parental leave I wanted to leave you with a brief summary and overview of the thoughts and ideas that form the foundation of the User Experience (UX) design in our game. Also, say hello to Aron whom I have written this dev diary in cooperation with. Aron has been my UX padawan for the past year and will be shouldering the UX while I am gone.

First and foremost, why do we do what we do? Basically, our end goal is to make the game more approachable and accessible, so that we can make it even deeper and more complex. Complexity should not come from not knowing where to find something and why something happened, but from the deep simulation and game mechanics at the core of our game. The more accessible the information and interactions can be, the more complex we can make that information and those interactions.

In order to get there, we have three UX Pillars

  1. The right information at the right time
  2. Clear feedback about cause and effect
  3. Clearly separate Actions from Information

What tools do we have at our disposal to provide a user experience that satisfies these lofty goals? In this Dev Diary we will walk you through some of our main tools and approaches.

Nested tooltip, as made famous by Crusader Kings 3​

There is one piece of technology we can not see this game without: Nested Tooltips. We use it both for Game Concepts, and for getting more detailed breakdowns of numbers, and boy do we have numbers! This allows us to achieve parts of the first UX Pillar, The Right information at the right time. Instead of having to explain every single detail and anecdote in a single humongous tooltip, we can focus on the most essential and important information for the current context and leave any information that might not be directly tied to this context for the nested tooltips to cover. This is crucial in Victoria 3 where every single thing affects a whole bunch of other things, some very important and others simply knock on effects.

DD29 01 concept v2.png


DD29 02 numbers v2.png


Of course Nested Tooltips come with their own set of challenges. This is where we are happy to allow for a lot of customization and tweaking. For example, how do you want the tooltip to lock? Mouse Tendency, Timer Lock, or Action Lock? If you choose the Timer Lock, how long do you want that timer to be? Etc.

DD29 03 menu tooltip.png

Another thing we show in these tooltips is the next thing on the agenda and what y’all been waiting for - graphs!

Data visualization​

One of the more challenging areas is to clearly give feedback of a value’s change over time. In a game with as many interlocking systems as Victoria, giving feedback on how something has changed over time becomes an essential part of the game-loop. How can we take several values and show you exactly how it has changed over time? You guessed it, line graphs.

DD29 04 Graph.png


We would never make a Victoria game without the proper amount of graphs and charts! (Yes, you can switch to show pie charts for the Victoria 2 purists.)

DD29 05 area chart.png


DD29 06 pie chart.png

Numbers that update in real time and Predictions​

In most cases in our previous games, you have to tick the game in order to see the effects of things. In Victoria, we try to make all the immediate effects of your actions available the second you take them. When taking actions that have consequences spreading far and wide throughout the game's systems, it can be really hard to parse if this is a good idea or not without excessive use of spreadsheet software. So we predict things for you. (With a nested tooltip breakdown of that prediction value of course!)

The Building panel provides you with all the raw building data you could ever need, for you to analyze however you like. For whatever action you may desire, we provide our warmest support in your calculating endeavors with predictions such as the Weekly Balance when changing Production Method and predicted Earnings of the building if you were to expand it.
DD29 07 Building details.png


DD29 08 Production Methods tooltip.png


DD29 09 coal mine.png

Focus on the Map​

Our map is gorgeous and we want to put more emphasis on it. For example, all Events in the game have a location on the Map, and if you hover over a State name in any text, that State will be highlighted on the Map. This makes it easier to connect the names of things with their representation on the map, giving context to the text and the map. However, one of the coolest contextual information we are creating are Map Modes. We have Map Modes connected to most of our information panels, triggering when you open each panel which gives you the right contextual information at the right time. With the use of icons, numbers, and different heatmaps, we enable you to see several layers of contextual information at the same time without things getting too cluttered and without you having to scroll through a big sheet of data. Albeit, all Map Modes also exist in list form, making it possible to sort the information that is shown on the map, not entirely unlike a visual Ledger.

DD29 10 Fabric goods heatmap.png

The Lenses​

Every action you can take on the map, you can take from the five Lenses. Production Lens, Political Lens, Diplomatic Lens, Military Lens, and Trade Lens - each Lens comes with its own Map Mode! Basically, it is like viewing your country from a specific point of view.
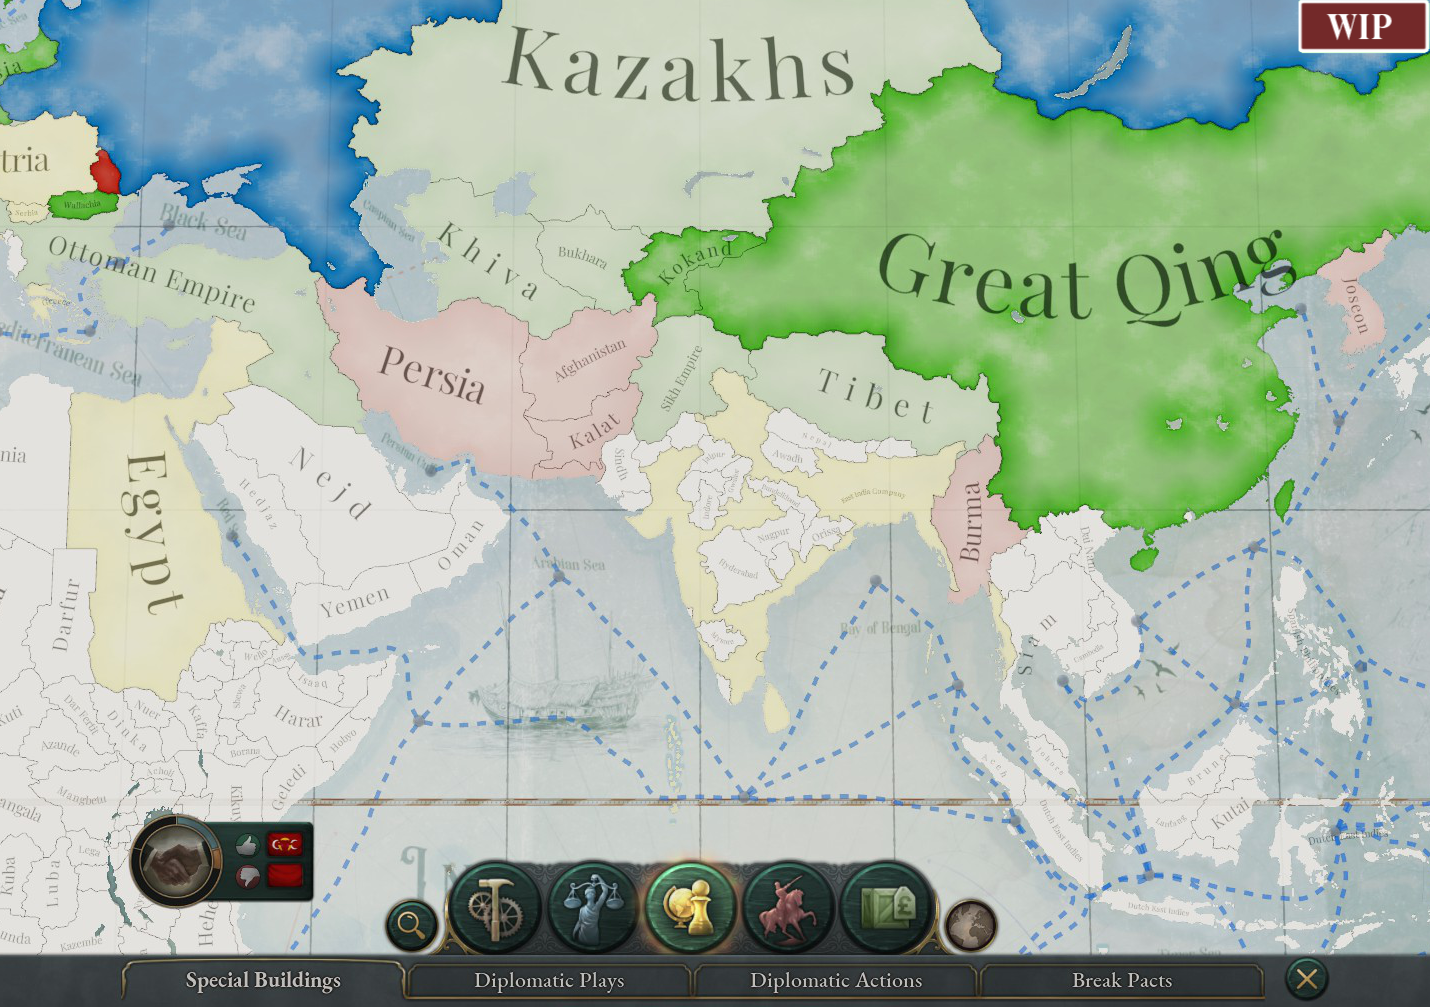
DD29 11 Diplo attitude v2.png


DD29 12 Iron Mines v2.png

Right-Click menus​

The Map Interactions in the Lenses are our take on the Macro Builder, that is when you know what action you want to take and then you select what type of entity to perform that action on. On the other side of the coin, we use Right-Click menus for when you know what entity you want to perform an action on and then select an action from a list of potential actions. We have this for States, Markets, Characters, Buildings, Interest Groups and Goods. So any time you see any of those in the game, you can right-click on them to get a list of actions you can perform.

DD29 13 Right-Click.png

Empty States​

Often forgotten, but extremely important. This is the feedback of dead ends, such as looking at the Urban Buildings tab of a State with no Urban Buildings. A useful empty state will let the player know what’s happening, why it’s happening, and what to do about it. In a State with no Urban Buildings we should of course tell this to the player, but also include the potential Urban Buildings which the player can build in that State. This is only one of many examples and you’d be surprised how often this simple yet important UX design aspect is forgotten. The empty state tells the player what that screen could be populated with and what the player can do about it.

DD29 14 No urban.png

Should you get an economics degree before you play V3?​

Far be it from us to ever discourage anyone from getting an economics degree! Yet, despite Victoria 3's immense depth and complexity, our intention is still to allow you to learn even the most advanced concepts the game is based on as you play. One aspect of this is the tutorial, which we are putting more focus onto than ever before and will cover in detail in a future Dev Diary. Another aspect is through tooltippable Game Concepts, which work much like an integrated dictionary or rule book. Whenever you see such a Concept in text, such as Pops, Dividends Taxes, or Market Price, you can tooltip it to get an explanation of what it means and references to related concepts and mechanics. This powerful tool together with the Nested Tooltips allows us to design and explain anything in the game without writing a novel in each tooltip, and as a player, you can choose to deep dive into any peculiarities as you see fit.

DD29 15 pop tooltip.png

Accessibility features​

Last but not least, we can not talk about UX without mentioning Accessibility and boy are we happy to have something never before seen in any PDS game - Colorblindness mode for text! We have it on our roadmap to make this feature work with more things in the game as well. We have also worked hard to get to a point where the UI scaling should work even better out of the box than previous releases.

Default mode, Tritanopia mode, and Protanopia/Deuteranopia mode
DD29 16 Colorblind 1.png

That’s all for the first dev diary of 2022 folks. What an exciting year we have in front of us with so many tooltips to design and improve on! We’ll be back next week where Kenneth, our 2D Art Lead, will guide you through a closer look at the UI design of Victoria 3. See you then!
 

Attachments

  • 16_9.jpg
    16_9.jpg
    978 KB · Views: 0
  • DD29 01 concept v2.png
    DD29 01 concept v2.png
    1,1 MB · Views: 0
  • DD29 02 numbers v2.png
    DD29 02 numbers v2.png
    382,8 KB · Views: 0
  • DD29 03 menu tooltip.png
    DD29 03 menu tooltip.png
    146,7 KB · Views: 0
  • DD29 04 Graph.png
    DD29 04 Graph.png
    128,6 KB · Views: 0
  • DD29 05 area chart.png
    DD29 05 area chart.png
    234,7 KB · Views: 0
  • DD29 06 pie chart.png
    DD29 06 pie chart.png
    310,2 KB · Views: 0
  • DD29 07 Building details.png
    DD29 07 Building details.png
    898,2 KB · Views: 0
  • DD29 08 Production Methods tooltip.png
    DD29 08 Production Methods tooltip.png
    652,7 KB · Views: 0
  • DD29 09 coal mine.png
    DD29 09 coal mine.png
    408,7 KB · Views: 0
  • DD29 10 Fabric goods heatmap.png
    DD29 10 Fabric goods heatmap.png
    1,4 MB · Views: 0
  • DD29 11 Diplo attitude v2.png
    DD29 11 Diplo attitude v2.png
    1,6 MB · Views: 0
  • DD29 12 Iron Mines v2.png
    DD29 12 Iron Mines v2.png
    1,6 MB · Views: 0
  • DD29 13 Right-Click.png
    DD29 13 Right-Click.png
    1,1 MB · Views: 0
  • DD29 14 No urban.png
    DD29 14 No urban.png
    970,3 KB · Views: 0
  • DD29 15 pop tooltip.png
    DD29 15 pop tooltip.png
    501,3 KB · Views: 0
  • DD29 16 Colorblind 1.png
    DD29 16 Colorblind 1.png
    1,2 MB · Views: 0
  • 201Like
  • 106Love
  • 13
  • 9
  • 2
  • 1Haha
Reactions:
If there are 30 coal deposits in Zacatecas, do we have to keep building for 30 years until we can reach full production, or can we build them all at once?
What about the 300-700 farms in Sichuan?

Will there be shortcuts like Ctrl+Click / Shift +Click to build 10 / 100 farms/mines of the same type?
Or do we have to wait for auto-expand when full employment has been reached?
 
Last edited:
If there are 30 coal deposits in Zacatecas, do we have to keep building for 30 years until we can reach full production, or can we build them all at once?
What about the 300-700 farms in Sichuan?
Will there be shortcuts like Ctrl+Click / Shift +Click to build 10 / 100 farms of the same type?
I believe that the speed of building will depend on (the quantity of) your construction firms.
 
Yay, nested tooltips continue the cause of the Revolution!
 
  • 1Like
Reactions:
Why, oh why do you (Paradox) keep insisting on makiung your UI so frustrating to read?

View attachment 795373
The contrast of the text compared to the background here is awful. Why do you keep doing this in your modern games? If you don't want players to read the text, don't have it there in the first place. I have spent large parts of my days for the past 20 years reading on screens, but rarely have I come across texts where I find it as straining to read as in CK3 and some of the Vic 3 screenshots. Aren't you guys are supposed to be spending time making these decisions?

In addition to the text/background colour you also chose to highlight about 30% of the text. I assume the orange highlighting means that there are some nested tooltips or clickable links for the player to interact with. When those five and a half lines contains pretty much every important aspect of the game it might be worth considering rewriting the text so it contains less highligted words, or just remove the highlighting entirely and let those wanting to know more click the 'Guide Me' button (which I assume contains more information). If players are supposed to read the text in its entirety at all that is. If we are not supposed to read it, why not just make a list of the key mechanics that are important to pops? Also, what is the purpose of the pound sterling in front of the 'Money'? Is it just auto generated whenever money is mentioned? In this case it just breaks up the sentence without any purpose whatsoever.

To me all these issues makes it look like someone decided you needed a tooltip just for the sake of having a tooltip. That's a bad tooltip.

View attachment 795381

11 words/numbers, 5 different colours. I hope it is very clear to new players what all those colours means.

View attachment 795374

Again, why is the contrast here so low? I realise that this text is just there to indicate that there is nothing at the moment, but with this little contrast I would have preferred the text to just not be there at all. I instantly see that there is some kind of text there, but it actually requires me to focus on on the text to be able to decide what it is. That seems to be the opposite of what the intention behind the low contrast is here, and I find it very distracting.

View attachment 795377
I realise this is WIP, but for the love of God, at least make the value the chart is supposed to show in a high contrast font colour in your early iterations. When something inevitably isn't reworked before launch it will then be presented in a somewhat acceptable state anyway. Why would anyone make the dates stand out more than the actual value in this chart? The dates aren't even important in this chart. They could be replaced with 'Start' and 'Today' and still provide the same information to the player. (but please give the dates the same font colour as the GDP).

For charts in general you may also want to skip the fading from light to dark background from top to bottom. The only real purpose it has in this case is to make it harder for the devs to highlight the important information in the chart. That seems like a bad idea.

Of course you may feel free to ignore all feedback regarding UX decisons/design like you (Paradox) did with Imperator and CK3 and make something that looks good on screenshots aimed at selling the game to people who never played your games. That's up to you.
Very much this.
At the very least add a High Contrast accessibility option that just sets all the text to white and the backgrounds to mid-dark (basically the forum format) and it would instantly make the game legible to those of us with bad eye-sight.
At least the horrible, blurry Paradox serif font from EU4 isn't widely used here.
 
  • 1Like
  • 1
Reactions:
Absolutely love the inclusion of the pie charts again. ;) I know the squares are more modern, but as Victoria is a traditional time, having a traditional layout bodes well.
 
  • 1Like
Reactions:
Absolutely love the inclusion of the pie charts again. ;) I know the squares are more modern, but as Victoria is a traditional time, having a traditional layout bodes well.
I appreciate the nostalgia factor of the pie charts and they do look fantastic. But treemap charts are a much better way to visualize differences.
 
  • 1
Reactions:
Greetings Paradox team,


already sent an E-Mail on taht topic but I have a question on the Colourblindness mode:

Do you intend do include a feature that allows players to combine the diffrent colour blind modes?
Beeing able to use only one of the modes (Deuteranope, Protanope or Tritanope) is an issue for some colour blind people and only few games offer the option to combine those features.

I'd be happy if you'd tackle that probleme (if you guys already solved this it would be even more awesome)


Best Regards
 
  • 1Like
  • 1Love
Reactions: