• We have updated our Community Code of Conduct. Please read through the new rules for the forum that are an integral part of Paradox Interactive’s User Agreement.

Victoria 3 - Dev Diary #29 - User Experience

16_9.jpg

Hello, my name is Henrik and I am a UX Designer on PDS. I have been a part of the Victoria 3 team for almost the entirety of the project, and since I am about to take a few months of parental leave I wanted to leave you with a brief summary and overview of the thoughts and ideas that form the foundation of the User Experience (UX) design in our game. Also, say hello to Aron whom I have written this dev diary in cooperation with. Aron has been my UX padawan for the past year and will be shouldering the UX while I am gone.

First and foremost, why do we do what we do? Basically, our end goal is to make the game more approachable and accessible, so that we can make it even deeper and more complex. Complexity should not come from not knowing where to find something and why something happened, but from the deep simulation and game mechanics at the core of our game. The more accessible the information and interactions can be, the more complex we can make that information and those interactions.

In order to get there, we have three UX Pillars

  1. The right information at the right time
  2. Clear feedback about cause and effect
  3. Clearly separate Actions from Information

What tools do we have at our disposal to provide a user experience that satisfies these lofty goals? In this Dev Diary we will walk you through some of our main tools and approaches.

Nested tooltip, as made famous by Crusader Kings 3​

There is one piece of technology we can not see this game without: Nested Tooltips. We use it both for Game Concepts, and for getting more detailed breakdowns of numbers, and boy do we have numbers! This allows us to achieve parts of the first UX Pillar, The Right information at the right time. Instead of having to explain every single detail and anecdote in a single humongous tooltip, we can focus on the most essential and important information for the current context and leave any information that might not be directly tied to this context for the nested tooltips to cover. This is crucial in Victoria 3 where every single thing affects a whole bunch of other things, some very important and others simply knock on effects.

DD29 01 concept v2.png


DD29 02 numbers v2.png


Of course Nested Tooltips come with their own set of challenges. This is where we are happy to allow for a lot of customization and tweaking. For example, how do you want the tooltip to lock? Mouse Tendency, Timer Lock, or Action Lock? If you choose the Timer Lock, how long do you want that timer to be? Etc.

DD29 03 menu tooltip.png

Another thing we show in these tooltips is the next thing on the agenda and what y’all been waiting for - graphs!

Data visualization​

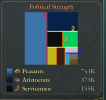
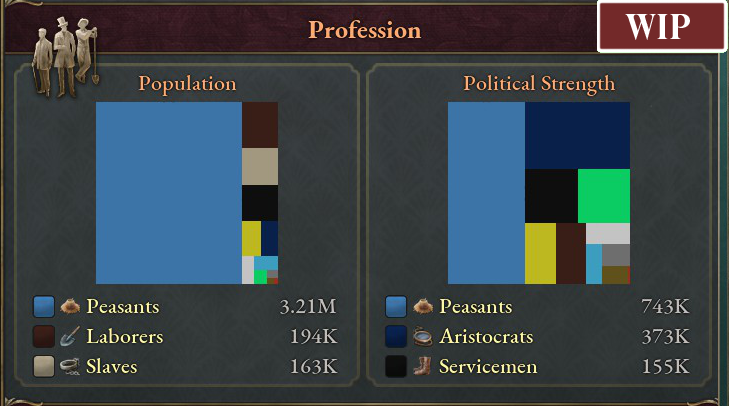
One of the more challenging areas is to clearly give feedback of a value’s change over time. In a game with as many interlocking systems as Victoria, giving feedback on how something has changed over time becomes an essential part of the game-loop. How can we take several values and show you exactly how it has changed over time? You guessed it, line graphs.

DD29 04 Graph.png


We would never make a Victoria game without the proper amount of graphs and charts! (Yes, you can switch to show pie charts for the Victoria 2 purists.)

DD29 05 area chart.png


DD29 06 pie chart.png

Numbers that update in real time and Predictions​

In most cases in our previous games, you have to tick the game in order to see the effects of things. In Victoria, we try to make all the immediate effects of your actions available the second you take them. When taking actions that have consequences spreading far and wide throughout the game's systems, it can be really hard to parse if this is a good idea or not without excessive use of spreadsheet software. So we predict things for you. (With a nested tooltip breakdown of that prediction value of course!)

The Building panel provides you with all the raw building data you could ever need, for you to analyze however you like. For whatever action you may desire, we provide our warmest support in your calculating endeavors with predictions such as the Weekly Balance when changing Production Method and predicted Earnings of the building if you were to expand it.
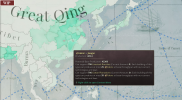
DD29 07 Building details.png


DD29 08 Production Methods tooltip.png


DD29 09 coal mine.png

Focus on the Map​

Our map is gorgeous and we want to put more emphasis on it. For example, all Events in the game have a location on the Map, and if you hover over a State name in any text, that State will be highlighted on the Map. This makes it easier to connect the names of things with their representation on the map, giving context to the text and the map. However, one of the coolest contextual information we are creating are Map Modes. We have Map Modes connected to most of our information panels, triggering when you open each panel which gives you the right contextual information at the right time. With the use of icons, numbers, and different heatmaps, we enable you to see several layers of contextual information at the same time without things getting too cluttered and without you having to scroll through a big sheet of data. Albeit, all Map Modes also exist in list form, making it possible to sort the information that is shown on the map, not entirely unlike a visual Ledger.

DD29 10 Fabric goods heatmap.png

The Lenses​

Every action you can take on the map, you can take from the five Lenses. Production Lens, Political Lens, Diplomatic Lens, Military Lens, and Trade Lens - each Lens comes with its own Map Mode! Basically, it is like viewing your country from a specific point of view.

DD29 11 Diplo attitude v2.png


DD29 12 Iron Mines v2.png

Right-Click menus​

The Map Interactions in the Lenses are our take on the Macro Builder, that is when you know what action you want to take and then you select what type of entity to perform that action on. On the other side of the coin, we use Right-Click menus for when you know what entity you want to perform an action on and then select an action from a list of potential actions. We have this for States, Markets, Characters, Buildings, Interest Groups and Goods. So any time you see any of those in the game, you can right-click on them to get a list of actions you can perform.

DD29 13 Right-Click.png

Empty States​

Often forgotten, but extremely important. This is the feedback of dead ends, such as looking at the Urban Buildings tab of a State with no Urban Buildings. A useful empty state will let the player know what’s happening, why it’s happening, and what to do about it. In a State with no Urban Buildings we should of course tell this to the player, but also include the potential Urban Buildings which the player can build in that State. This is only one of many examples and you’d be surprised how often this simple yet important UX design aspect is forgotten. The empty state tells the player what that screen could be populated with and what the player can do about it.

DD29 14 No urban.png

Should you get an economics degree before you play V3?​

Far be it from us to ever discourage anyone from getting an economics degree! Yet, despite Victoria 3's immense depth and complexity, our intention is still to allow you to learn even the most advanced concepts the game is based on as you play. One aspect of this is the tutorial, which we are putting more focus onto than ever before and will cover in detail in a future Dev Diary. Another aspect is through tooltippable Game Concepts, which work much like an integrated dictionary or rule book. Whenever you see such a Concept in text, such as Pops, Dividends Taxes, or Market Price, you can tooltip it to get an explanation of what it means and references to related concepts and mechanics. This powerful tool together with the Nested Tooltips allows us to design and explain anything in the game without writing a novel in each tooltip, and as a player, you can choose to deep dive into any peculiarities as you see fit.

DD29 15 pop tooltip.png

Accessibility features​

Last but not least, we can not talk about UX without mentioning Accessibility and boy are we happy to have something never before seen in any PDS game - Colorblindness mode for text! We have it on our roadmap to make this feature work with more things in the game as well. We have also worked hard to get to a point where the UI scaling should work even better out of the box than previous releases.

Default mode, Tritanopia mode, and Protanopia/Deuteranopia mode
DD29 16 Colorblind 1.png

That’s all for the first dev diary of 2022 folks. What an exciting year we have in front of us with so many tooltips to design and improve on! We’ll be back next week where Kenneth, our 2D Art Lead, will guide you through a closer look at the UI design of Victoria 3. See you then!
 

Attachments

  • 16_9.jpg
    16_9.jpg
    978 KB · Views: 0
  • DD29 01 concept v2.png
    DD29 01 concept v2.png
    1,1 MB · Views: 0
  • DD29 02 numbers v2.png
    DD29 02 numbers v2.png
    382,8 KB · Views: 0
  • DD29 03 menu tooltip.png
    DD29 03 menu tooltip.png
    146,7 KB · Views: 0
  • DD29 04 Graph.png
    DD29 04 Graph.png
    128,6 KB · Views: 0
  • DD29 05 area chart.png
    DD29 05 area chart.png
    234,7 KB · Views: 0
  • DD29 06 pie chart.png
    DD29 06 pie chart.png
    310,2 KB · Views: 0
  • DD29 07 Building details.png
    DD29 07 Building details.png
    898,2 KB · Views: 0
  • DD29 08 Production Methods tooltip.png
    DD29 08 Production Methods tooltip.png
    652,7 KB · Views: 0
  • DD29 09 coal mine.png
    DD29 09 coal mine.png
    408,7 KB · Views: 0
  • DD29 10 Fabric goods heatmap.png
    DD29 10 Fabric goods heatmap.png
    1,4 MB · Views: 0
  • DD29 11 Diplo attitude v2.png
    DD29 11 Diplo attitude v2.png
    1,6 MB · Views: 0
  • DD29 12 Iron Mines v2.png
    DD29 12 Iron Mines v2.png
    1,6 MB · Views: 0
  • DD29 13 Right-Click.png
    DD29 13 Right-Click.png
    1,1 MB · Views: 0
  • DD29 14 No urban.png
    DD29 14 No urban.png
    970,3 KB · Views: 0
  • DD29 15 pop tooltip.png
    DD29 15 pop tooltip.png
    501,3 KB · Views: 0
  • DD29 16 Colorblind 1.png
    DD29 16 Colorblind 1.png
    1,2 MB · Views: 0
  • 201Like
  • 106Love
  • 13
  • 9
  • 2
  • 1Haha
Reactions:
  1. As of right now, the interval is usually set from the beginning of the game, with either daily, weekly, or monthly sampling. However, some graphs make more sense to have shorter intervals on and for those we have that, although there are constant ongoing tweaks and improvements on this. Customizability of this is on our roadmap. As for your second question: For GDP, we do have the interval from the beginning of the game as you can see in the screenshot, so, yes you will be able to see a graph with your evolution of your GDP.
  2. Yes, the predicted Earnings of you building or expanding a building will be in the tooltip of that action, regardless if you do it through the panels or on the map through the lenses.
  3. Tagging in @lachek to answer this one! - "While Population numbers are state-based, we know which Pops work in which buildings and we know which buildings belong to which cities. At the moment we don't slice the data such that you can see how many people live in what city since it doesn't do anything for gameplay, but we're looking into ways of visualizing this breakdown of state populations as well."
Thanks for the answers. Regarding the population of the city, it may not be important for gameplay itself, but seeing that a City has 230k inhabitants is more immersive than see a size 30 city IMHO.
In any case, really good work and thanks again.
 
  • 7
  • 1Like
Reactions:
This is so crucial because Paradox games are in real time: the longer it takes to become aware of a situation, the more time is lost dealing with it. Notifications and events, including auto-pause, are essential to allow people to manage that. Like pointed out, this folds directly back into your primary design goal. The player should succeed in the game because of their understanding of the system and making the right decisions based on that, not based on whether or not they noticed a thing happening or not. Otherwise playing the game because a tedious task of constant vigilance, and reading every notification even if most are a waste of attention. Notification settings and automated pausing must be part of the UX consideration, and I hope the UX team sees it the same way, because otherwise that aspect of giving the player control over the game seems to have nobody who actually "owns" and cares about it.

I'd rather dig through an overwhelming amount of settings once and then play the game the way I want for the many many hours after, than deal with an excessive amount of undesired notifications and the stress of not having my game paused when I want to forever. Not to mention that for most people, the process usually was that they got a notification and decided either a) that they no longer want it to pause the game, b) no longer be notified at all, or c) want it to pause the game in the future and then made the appropriate change for the event right then and there. The number of options doesn't even matter in that case.

There are many ways in which the way these settings work in EU4 work could be improved, and I am happy to discuss them. But to do that they first need to come back. Just taking them away and declaring victory does not solve anything.
Cannot stress this enough!
 
  • 8
  • 1Like
Reactions:
View attachment 793814
I really like this DD overall, except this image. This kind of visualization always give me more questions than answers and just piss me off overall. Why GDP is yearly if the graph show weakly? Why Y axis goes 36.6K? What is the two date? Why there is no horizontal or vertical lines helping me measure. Why there is no more data on the X,Y axis? Why not zoomed in when half the Y axis empty?
I can't see the context of the image, therefore maybe i totally wrong and i obviously biased by other games so take my comment with a pinch of salt.
This graph shows the GDP from the beginning of the game to the current in-game date, which means you can at least get a hum of how your GDP has changed over time. Graphs are a constant work in progress and we have it in our roadmap to be able to hover on any point in the graph and display the date and data of that point. Regarding the graph not filling up all the way, that is currently not working as designed, it should fill up all the way.
 
  • 21Like
  • 10
  • 1Love
Reactions:
It might not be 100% appropriate to ask this on a videogame forum, but I have a fairly high esteem of this community and the developers, so I will ask.
What are the benefits of the square graphic over the pie one? I've seen the new one ever more often even on scientific literature.
Thanks in advance.
Also, I hope the colors will see a rework, they don't seem to be different enough to eachother, and I'm not even colorblind.
 
i have thought of this, we can actually get them from the save file and make a script to convert it to CSV with relevant data, so that could be a way to do our own spread sheet as we want.

I'm actually currently hyped to try to make a web app reading those save files and showing a customizable dashboard of the data (just to get what we want exactly outside of the game). I think its technically doable to update the web app with the save file. We will see if i keep the will to do this but i'll probably try a prototype with eu4 files to see if its doable
For other games it would just be overkill, but an "export to CSV" button would actually be a fun thing to add to Vic3. Not that I would use it, but there are probably people out there who would.
 
  • 2Like
  • 1Love
  • 1Haha
Reactions:
Dear UI team, I have only one wish. Do NOT use the mouse middle button for anything. This made Imperator unplayable at launch.

(EDIT: for the people downvoting this: Do you realize many mouses, especially laptop touchpads, do not have middle mouse button? So putting features behind it makes the game literally unplayable for many players.)
 
Last edited:
  • 6
  • 2Like
  • 1
Reactions:
My only question concerns the lenses: are they the only five mapmodes that we have, or will there be more than those five mapmodes?
 
  • 2Like
Reactions:
What's the order in the treemap? Pie charts are better ways to represent just the proportions between groups, while treemaps help with visualizing the order of the subgroups, but I don't really see what it represents here. Why is it visualized this specific way? It could get split into the final visualization in step 1 after all.
 

Attachments

  • chart.png
    chart.png
    100,6 KB · Views: 0
  • 1
Reactions:
Pie charts are better ways to represent just the proportions between groups
Pie charts are empirically terrible for any situation with more than three slices. Someone linked the study.
 
  • 7
  • 2Like
Reactions:
Pie charts are empirically terrible for any situation with more than three slices. Someone linked the study.
It may be just me, but despite the number of slices in the profession pie charts, I find it easier to estimate the percentage of each group from the pie chart than from the tree map.
 
  • 4Like
  • 1
Reactions:
It may be just me, but despite the number of slices in the profession pie charts, I find it easier to estimate the percentage of each group from the pie chart than from the tree map.
I can't estimate finer than quarters on a pie chart.
 
Pie charts are empirically terrible for any situation with more than three slices. Someone linked the study.

Yeah, I started to write a response where I questioned why they don't have bar charts instead (the human eye can compare one dimension - height - better than two dimensional areas), but then decided it wasn't worth arguing with people about it.

And I don't mean stacked bar charts, which would fit thematically with how they are handling block/pie charts, but would have the weakness of squeezing the data into a single dimension (thus forcing the compression of the heights). Just a regular old plain jane run of the mill bar chart with heights next to each other. There is a reason people use bar charts to compare things. They are the best.
 
  • 4
  • 1Like
Reactions:
I can't estimate finer than quarters on a pie chart.
Well, I don’t find it easy to estimate finer that quarters in a tree map either.
Not only that but I can estimate percentages around 8% more or less in a pie chart, whereas I find it impossible in a tree map. If you imagine the pie chart like a clock, each 5 minutes is 8%.
In any case for a quick overview (That’s what charts should be used for) I find more easy to estimate in quarters in a pie chart than a tree map. For more precise than that, we should have a table anyway.
 
  • 4
Reactions:
Pie charts are empirically terrible for any situation with more than three slices. Someone linked the study.
Pie charts can be not great at it and yet they are still better. With treemap you get the option to plot on a 2D image additional information but in turn make it less clear what the proportions are. Pie charts are usually sorted, so you can at a quick glance tell which part is bigger without estimating - you just have this information. Treemaps on the other hand can't be sorted and keep their unique use. Tell me please, what population is larger: pink or purple
They are the same size

I am happy there is a choice to switch to pie charts, and I don't have a problem with treemaps being an option. I just want to know what is the information being presented on them... and if it's not just random placement of blocks.
 

Attachments

  • aaaa.png
    aaaa.png
    738 bytes · Views: 0
  • 2Like
  • 1
  • 1
Reactions:
One of the reasons treemaps are much better than pie charts is that it's much easier to tell the relative sizes of the smaller area not just to the whole but to each other on a treemap than it is on a pie chart, so you can get a lot more info at a glance from the treemaps even without the exact numbers. For instance, looking at this

DD29%2005%20area%20chart.png


you can pretty easily tell that the servicemen have about 9 times the population of the turquoise-ish group, but they have about equal political strength. Or that the light grey group has about 3.5 to four times as much political strength relative to its population. Both those things are useful information, and neither of those pieces of information are readable from the pie charts.
 
  • 4Like
  • 4
  • 1
Reactions:
you can pretty easily tell that the servicemen have about 9 times the population of the turquoise-ish group, but they have about equal political strength. Or that the light grey group has about 3.5 to four times as much political strength relative to its population. Both those things are useful information, and neither of those pieces of information are readable from the pie charts.
  1. The information is indeed easier to read on this chart, but it's also readable on the pie chart. Saying that it's just not accessible there is a lie. I don't have any problem with getting similar information from it.
  2. Green and black on both treemaps here have similar, square shape. It makes comparing them very easy, but is by no means the only possibility. You can end up comparing two very different in proportions rectangles with a treemap. Picking a best case scenerio example isn't really reflective of the whole issue. The moment you go into the light grey you start estimating, because the shapes diverge too much.
 
  • 2
  • 1Like
  • 1
Reactions:
I strongly agree with your post 100% but I especially would like to highlight the argument being made here.

I love everything I am reading in the dev diary, especially the overall design goals, but I am worried about what (feels like deliberately) not being mentioned. The perspective taken on UX design reads like it comes from experiences/best practices that come out of the web design and general application design space, and I wonder if that is the background that the UX people on this team have (which is not a criticism because that is where most practices are developed).

The difference between a web/desktop application generally and a game however is that for the former, they are usually static except in the case of user interaction. I click a button, something happens, new information is shown to me. It's very important that the user knows what clicking a button will do, that the application communicates what happened in response, and that the information displayed is easy to parse while also sufficient for the user's needs. I think the dev diary covers that flow perfectly.

However for games, the game also interacts with the player. There will constantly be stuff happening in the simulation, and actions from AI opponents, that also cause things to happen and change the game state. That is fundamentally different from most other applications and not at all captured in my summary above nor is it really addressed in this dev diary.

Like Axe99 pointed out, this fact is fundamental to how players interact with the game. I would even say it is more important than interaction that start with the intention of the player, because at least the player is always aware of what they want to do, even if the UI makes it difficult to find out how and what the consequences were. But if information about changes in the game state that were not caused by the player is not properly communicated, the player may not even be aware of them and never look, even if they know how and are given the best tools possible.

This is so crucial because Paradox games are in real time: the longer it takes to become aware of a situation, the more time is lost dealing with it. Notifications and events, including auto-pause, are essential to allow people to manage that. Like pointed out, this folds directly back into your primary design goal. The player should succeed in the game because of their understanding of the system and making the right decisions based on that, not based on whether or not they noticed a thing happening or not. Otherwise playing the game because a tedious task of constant vigilance, and reading every notification even if most are a waste of attention. Notification settings and automated pausing must be part of the UX consideration, and I hope the UX team sees it the same way, because otherwise that aspect of giving the player control over the game seems to have nobody who actually "owns" and cares about it.

That would be to the detriment of the enjoyment of this game.


I had the same reaction when I saw that.

When it comes to the tooltip settings itself, what is being sold as customisability feels more like Paradox was unsure about the right tolerances when originally introducing the nested tooltip feature in CK3, and instead of doing the work of figuring out which values work the best they just made everything customisable so that if people were unhappy, they could at least fix it for themselves. Which, to be clear, is a lot better than terrible default settings that cannot be changed in any way (hello event settings). But still, with something so subconsciously experiential like tolerances and durations, I wonder how many people actually know which exact setting to adjust when popups feel off to them. More approachable settings would have probably been better, although in the grand scheme of things it doesn't matter all that much.

What it does show though is a weird discordance when it comes to customisation. It feels arbitrary which parts of the UX are and aren't customisable and to which degree. Even worse, it does not seem to be in proportion to how important the customised aspect of the UX is. Receiving important information about the game, and enabling me to respond to it if necessary, is vastly more important than a tooltip feeling off.


This is a pretty bad argument built on the perfect solution fallacy.

I agree that old school message settings were clunky and tedious to interact with because of the amount of things to configure. But it is still better than not being able to configure anything at all.

I'd rather dig through an overwhelming amount of settings once and then play the game the way I want for the many many hours after, than deal with an excessive amount of undesired notifications and the stress of not having my game paused when I want to forever. Not to mention that for most people, the process usually was that they got a notification and decided either a) that they no longer want it to pause the game, b) no longer be notified at all, or c) want it to pause the game in the future and then made the appropriate change for the event right then and there. The number of options doesn't even matter in that case.

There are many ways in which the way these settings work in EU4 work could be improved, and I am happy to discuss them. But to do that they first need to come back. Just taking them away and declaring victory does not solve anything.


Agreed. Sad to see that people found a reason to disagree with your post. Shame on those people.

Cheers Leoreth, you said it better than me - the current UX as presented in this DD is excellent for a 'passive' game where the player is the only one that initiates anything (and anything the player initiates can't lead to a chain-reaction causing something in the future at an uncertain time) - but that's not the type of game Vicky 3 is. It is a little odd that even with dev responses in the thread there's something of an awkward silence about them, but I'm sure the devs have a plan, and I wish them the best of luck with it :) Given the weaknesses of the UX's in Stellaris, CK3 and HoI4 when it comes to providing the right information at the right time, I'd be telling fibs if I wasn't a little concerned, but the game more broadly looks exceptional, and I'll grab it and see how it goes regardless.

It might not be 100% appropriate to ask this on a videogame forum, but I have a fairly high esteem of this community and the developers, so I will ask.
What are the benefits of the square graphic over the pie one? I've seen the new one ever more often even on scientific literature.
Thanks in advance.
Also, I hope the colors will see a rework, they don't seem to be different enough to eachother, and I'm not even colorblind.

The great pie/tree debate! As well pointed out by @MTGian , if we really want a way to compare groups (particularly lots of different groups), then a bar (or column, which is just a bar chart sideways) chart with labels for the percentage covered, and tables, are the way to go. Both pie and tree charts sacrifice analytical nuance for visual appearance.

Pie charts are empirically terrible for any situation with more than three slices. Someone linked the study.

The tree charts are hardly better though (see my example below of what's required to compare areas in a tree vs a pie chart) - personally, I find the pies easier to interpret, but neither are great at large numbers of groups or for robust analysis (bar charts/tables win that competition by some margin). In either case, remember that our brains do funny things when comparing areas (and doubly so if those areas are different colours), and just relying on "visual impression" may lead to a misleading impression of the actual area covered - whether it's a pie or a tree.

you can pretty easily tell that the servicemen have about 9 times the population of the turquoise-ish group, but they have about equal political strength. Or that the light grey group has about 3.5 to four times as much political strength relative to its population. Both those things are useful information, and neither of those pieces of information are readable from the pie charts.

You may be able to, but for me to do that I'd need to pull the ruler out, calculate the surface area of each shape, then compare them. As the shapes are often irregular in size, and not laid next to each other, I personally find it harder to do than with a pie chart, and it requires more calculation steps for the tree chart (for example, with a pie chart all you need to do is compare the different size of the arc of the circle - one ruler measurement and no maths - whereas with the tree chart each block needs two ruler measurements, and then a calculation of area, and then a comparison).

That said, though - given the devs are providing both, the debate is somewhat academic - both the pie and tree people get to be happy - so we don't really need to know which is 'better' or 'worse' - whether people prefer squares or circles, everyone wins :)
 
  • 4Like
  • 1
Reactions:
Pie charts can be not great at it and yet they are still better. With treemap you get the option to plot on a 2D image additional information but in turn make it less clear what the proportions are. Pie charts are usually sorted, so you can at a quick glance tell which part is bigger without estimating - you just have this information. Treemaps on the other hand can't be sorted and keep their unique use.
Claiming treemaps can't be sorted when we have examples of standard sorted treemaps literally in the dev diary doesn't really help your argument. Neither does using a deliberately unsorted treemap.
 
  • 2
  • 1Like
  • 1
Reactions: