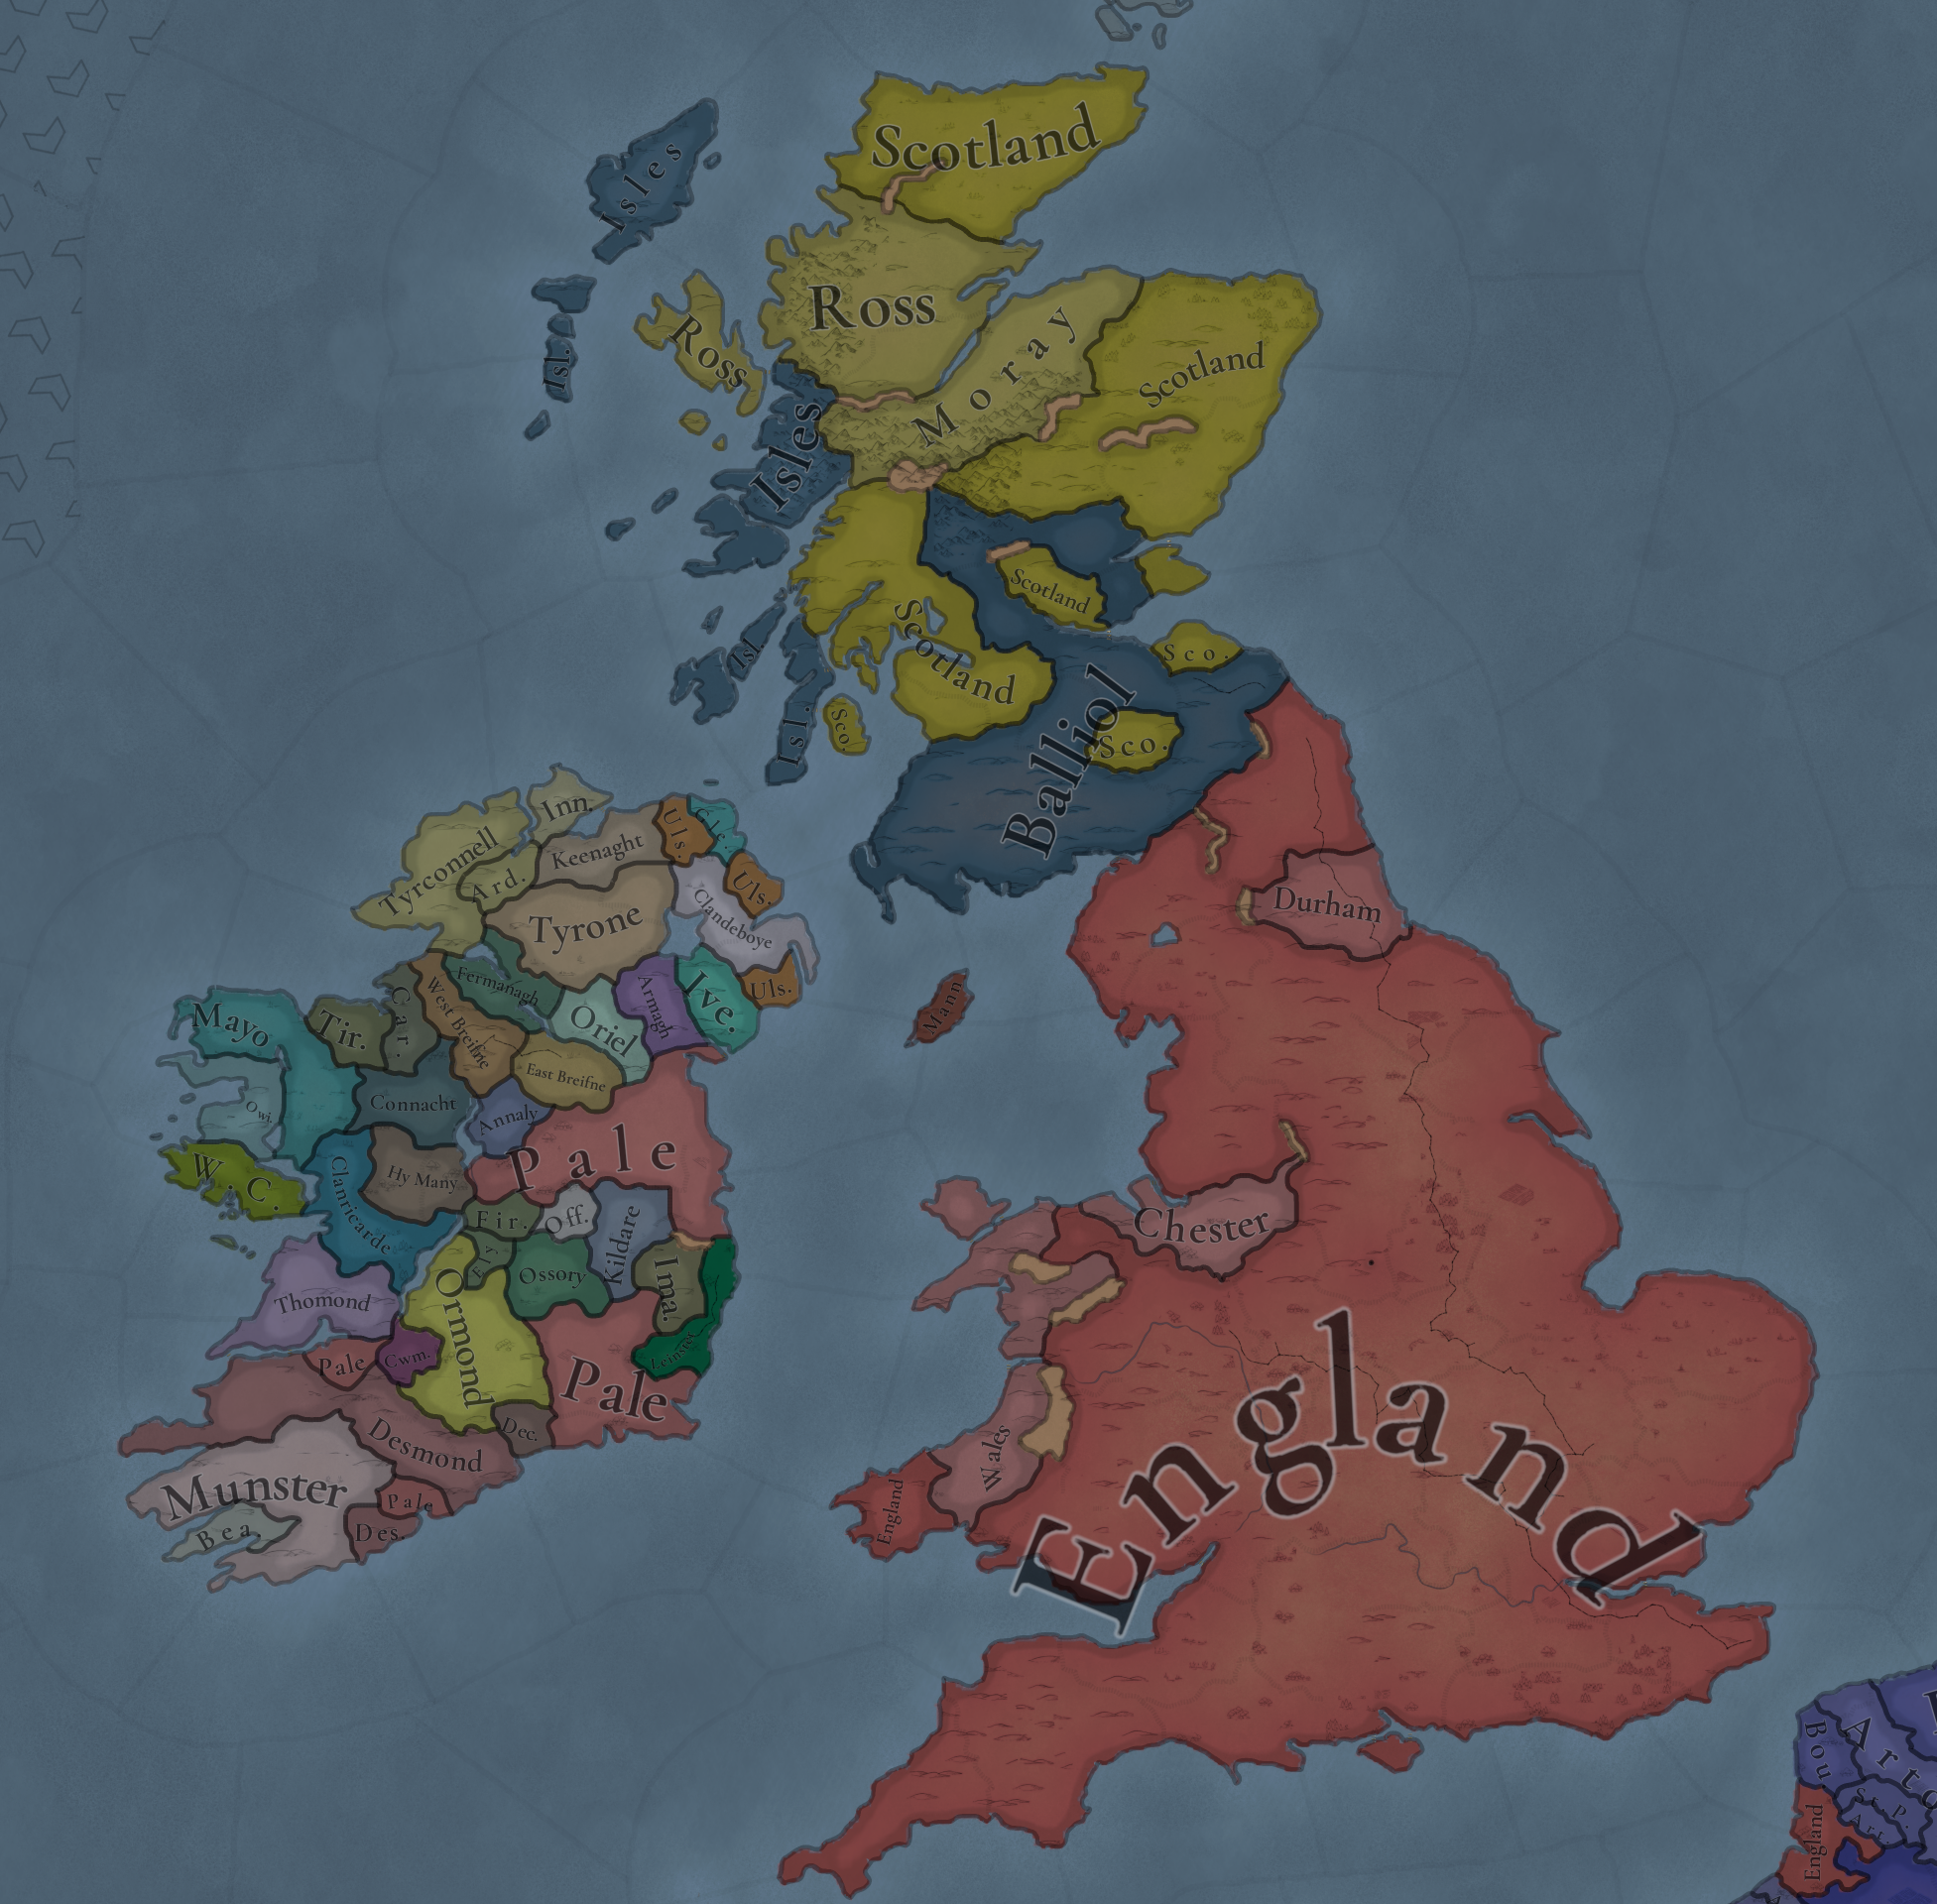
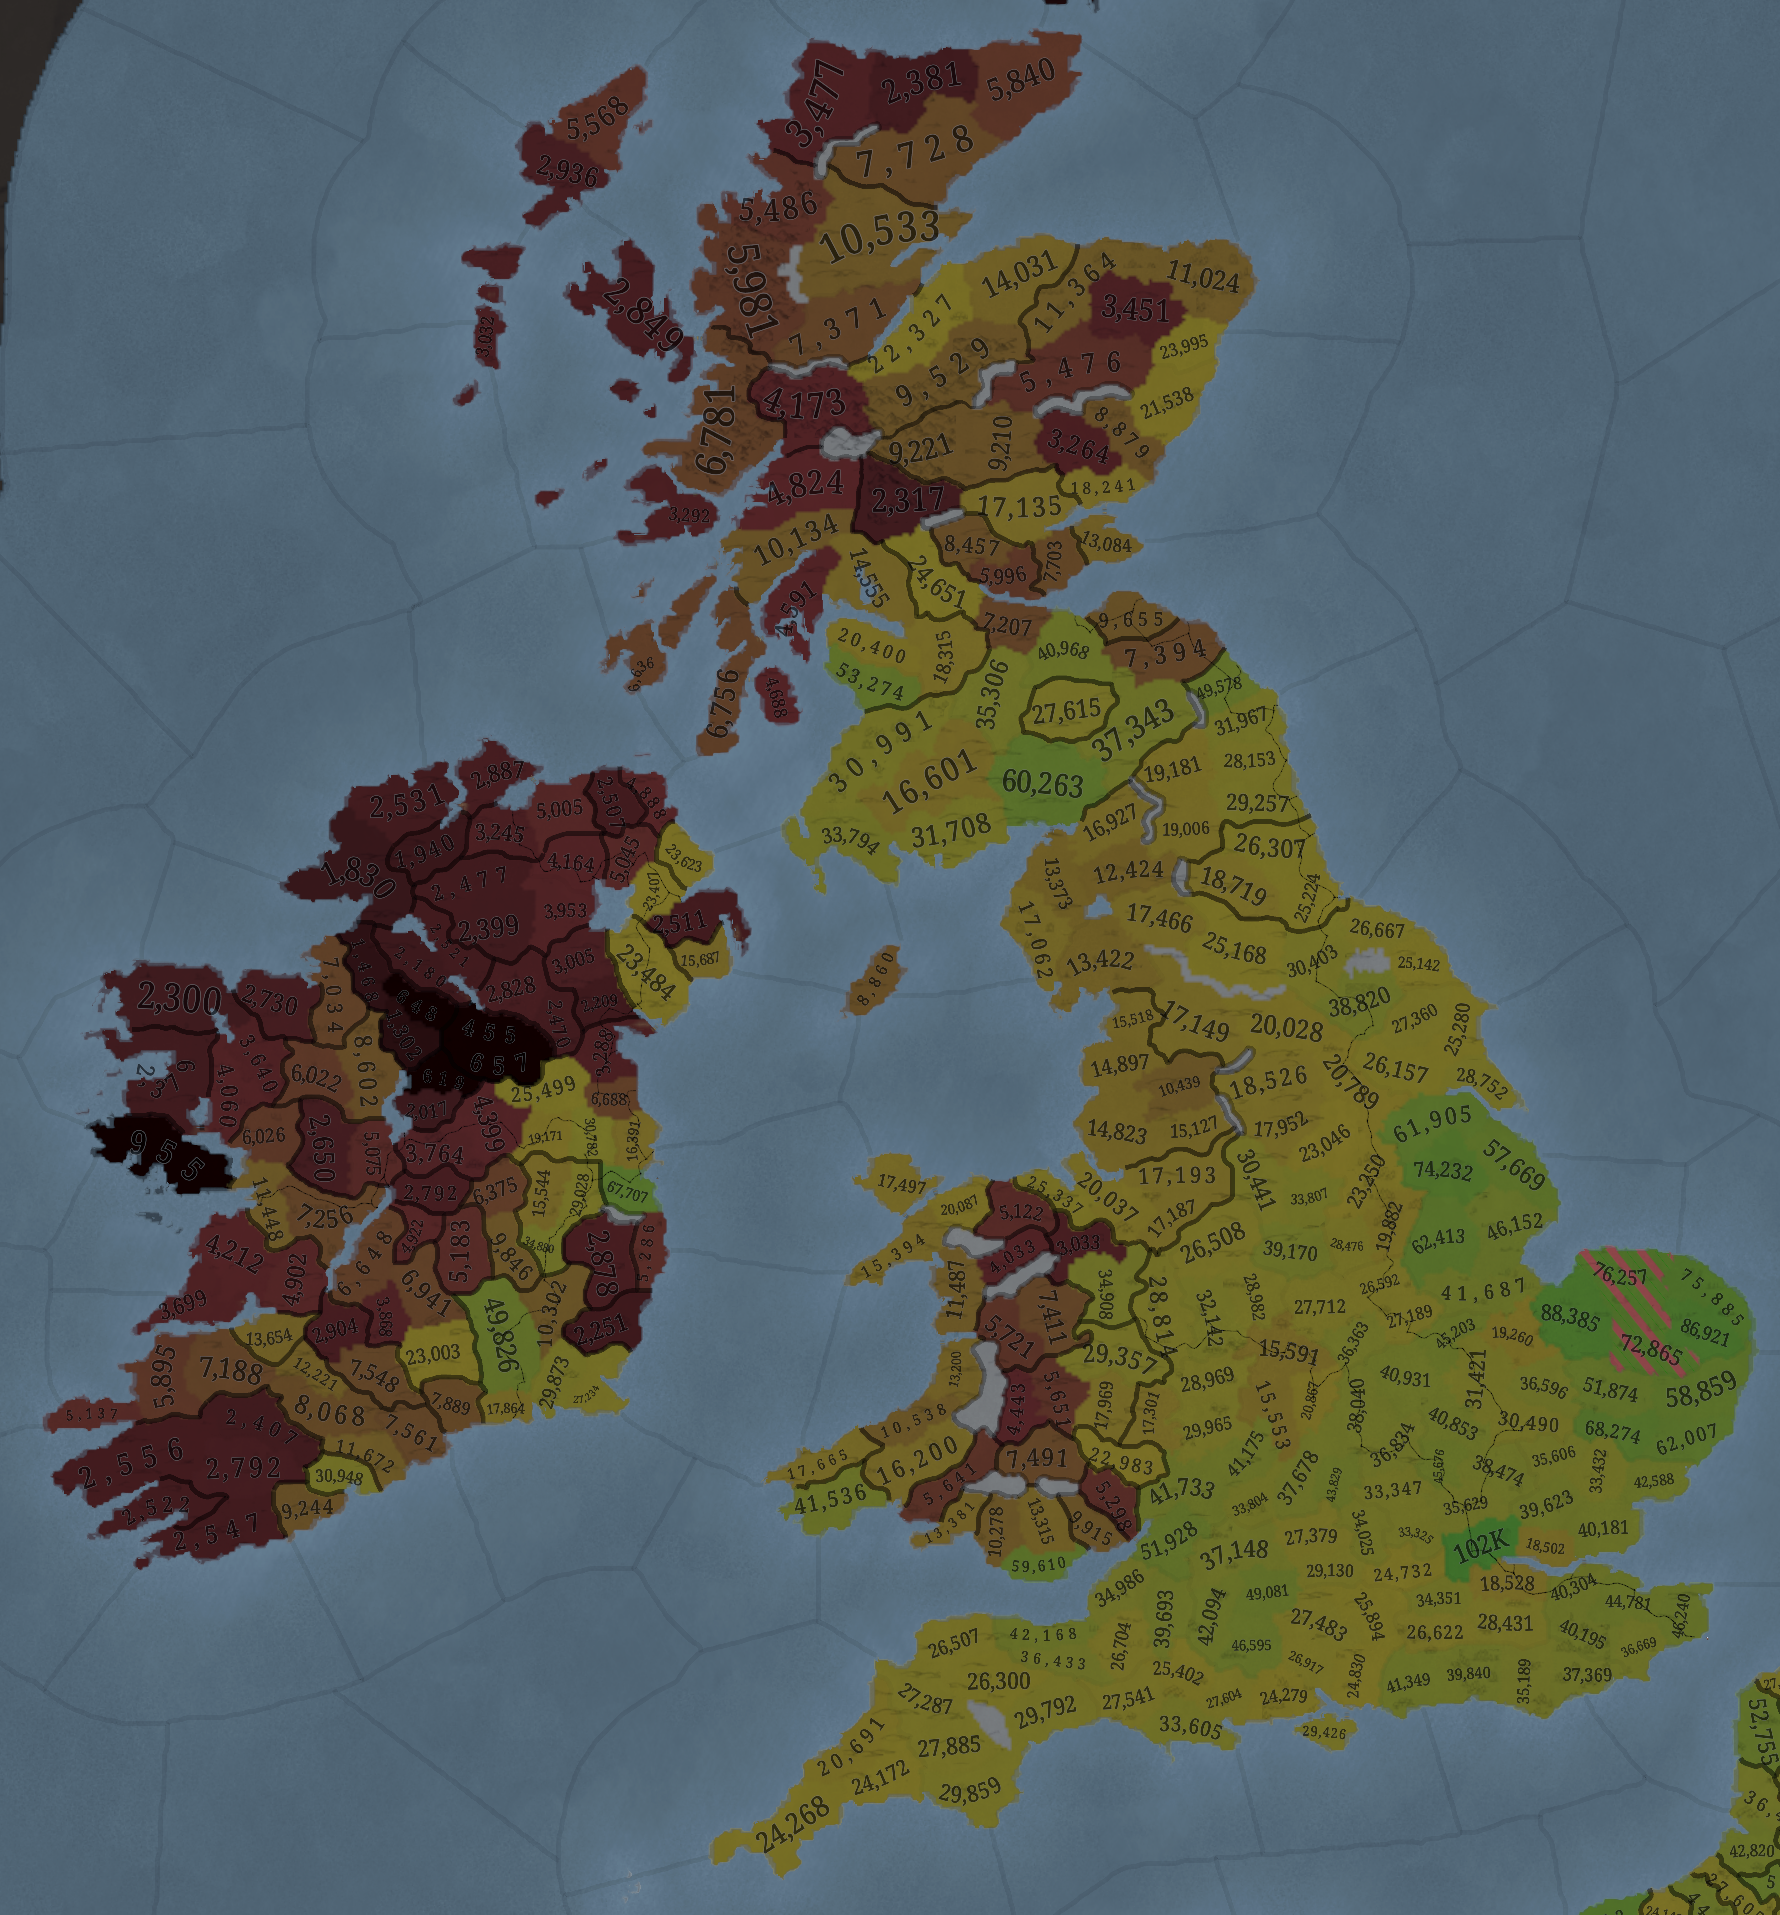
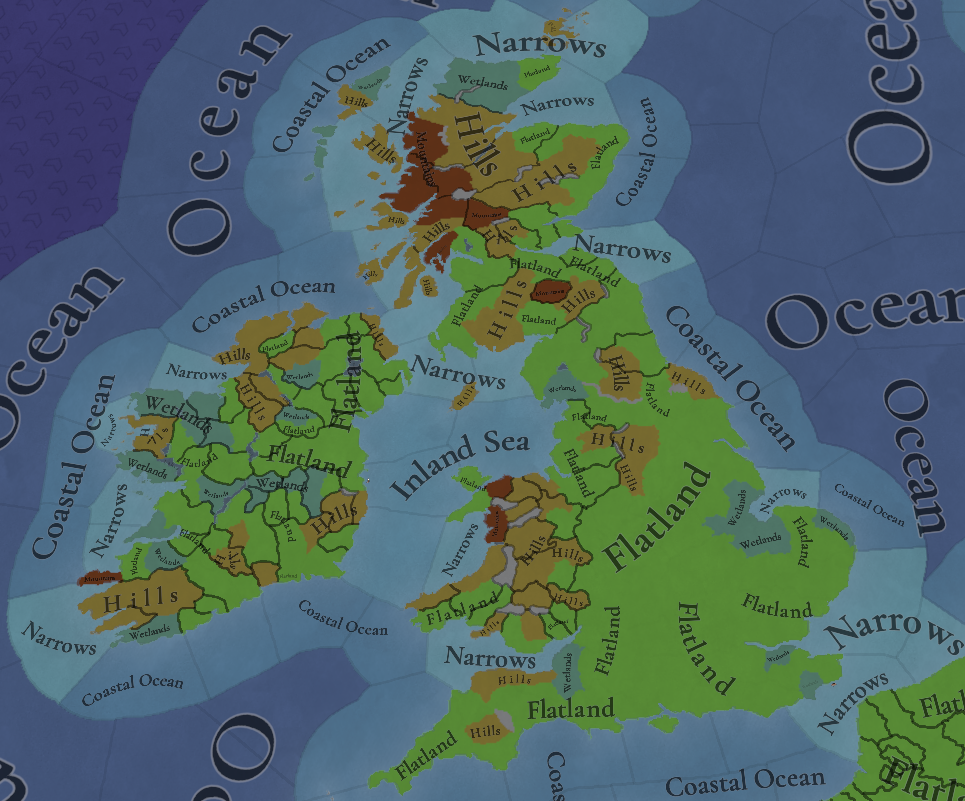
I was successful at finding a couple of articles that geographically show the wealth distribution. I'll show some results from the better of the two (it was a response to the first). The article is "The Geographical Wealth Distribution of England 1334 - 1649" by RS Schofield (
https://www.jstor.org/stable/2592561?read-now=1&seq=1#page_scan_tab_contents). It is behind a registration wall.
Here is a graph for 1341 wealth distribution (shading code is in the next image)
Here is a graph for 1515 wealth distribution.
Here is a table that includes the numerical ratings for both.
* - As referenced in the image, Kent is higher than is shown here because of the Cinque Ports. I found another article that rated Kent as the same as Gloucestershire for Lay wealth only (14th century data). So, I think it makes sense to add 3.5 points to the Kent scores for both Lay and Lay + Clerical for 1334. Unfortunately, I haven't found a way to adjust the 1515 data set.
** - Oh, ignore the 2x in the column headers of the table. That was done to make the lay number and the clerical number compatible. One was based on income, while the other was based on movable goods, so an adjustment was done, which is the 2x shown.
*** - The graphs shown are the lay and clerical combined. My assumption was that Paradox did not break them out. I can present the lay graphs only, if people want to see those images.
Some Reflections:
1) Norfolk and the area around the Wash estuary was a wealthy area in the 14th century. That is not reflected in the Paradox map at the moment. That area jumped off the page as the most incorrect to me. It's supposed to be high, but instead is low.
2) I referenced Somerset above as a well off area. It looks like that was more of an early 16th century thing than a 14th century thing. In fairness, my sources were 16th century, so that actually kinda makes sense.

3) If you look at the numerical ratings, there are some really low ratings for the north and southwest in the 14th century. Lancashire, the North and West Riding, and Cornwall and Devon are all in single digits, which really stands out when most counties were at least double that. My guess is that if Northumberland was listed, it would also be in the same company. I'm less certain of Durham because of the prince bishopric thing, but it probably wasn't high. The hard part in figuring out where those ratings should be is that we don't have values for Wales/Scotland to compare against, but they seem a bit high to me at the moment.
I haven't gone through county by county, but those were the ones that jumped off the page to me. Norfolk/Wash area too low (by a lot), Cornwall/Devon/north too high (by a little).


